
User Manual

20060301
2-10-3
Using the Main Application in Combination with Other Applications
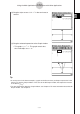
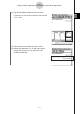
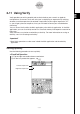
(3) Drag the stylus across “
x
^2 – 1” in the work area to
select it.
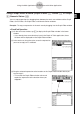
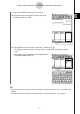
(4) Drag the selected expression to the Graph window.
• This graphs
y
=
x
2
– 1. This graph reveals that
the
x
-intercepts are
x
=
p
1.
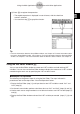
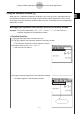
Tip
• As can be seen in the above example, a graph can be drawn when you drop an expression in the
form of
f
(
x
) into the Graph window. In the case of the 3D Graph window, the expression must be
in the form of
f
(
x
,
y
).
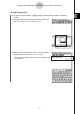
• For more information about the Graph window, see Chapter 3. For more information about the 3D
Graph window, see Chapter 5.