
User Manual

20090601
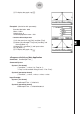
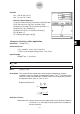
(7) To display the graph, tap
.
Example 2 (calculation with parameter)
Standard deviation : 80.6
Mean : 295.6
Sample size : 9
Assumed population mean : 250
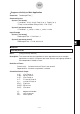
• Statistics Wizard Operation
(1) On the menu bar, tap [Calc] and then [Test].
(2) Select [One-Sample TTest] and [Variable], and
then tap [Next >>].
(3) Select the
μ
condition [
x
] and input values.
(4) Tap [Next >>].
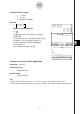
(5) To display the graph, tap
.
S
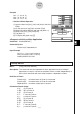
Program, eActivity or Main Application
Command: OneSampleTTest
:
Command Syntax
Syntax 1 (list format)
“
μ
condition”,
μ
0
value, List, Freq (or 1)
* “Freq” can be omitted. Doing so sets “1” for “Freq”.
Syntax 2 (parameter format)
“
μ
condition”,
μ
0
value,
M
value,
s
x
value,
n
value
Input Example:
Syntax 1 (list format)
OneSampleTTest “
x
”,250,list1,1
Syntax 2 (parameter format)
OneSampleTTest “
x
”,250,295.6,80.6,9
7-9-9
Tests