
User Manual

20101001
7-9-16
Tests
I
2-Sample
F
Test
2-Sample
F
Test
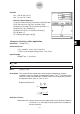
Menu: [Test]-[Two-Sample FTest][Test]-[Two-Sample FTest]
Description: This command tests hypotheses concerning the ratio of the population
variance of two populations. A 2-Sample
F
Test uses
F
distribution.
Definition of Terms
σ
1
condition: population standard deviation test conditions (“
x
” specifies two-
tail test, “<” specifies one-tail test where sample 1 is smaller than
sample 2, “>” specifies one-tail test where sample 1 is greater than
sample 2.)
List(1) : list where sample 1 data is located
List(2) : list where sample 2 data is located
Freq(1) : frequency of sample 1 (1 or list name)
Freq(2) : frequency of sample 2 (1 or list name)
s
x
1
: sample standard deviation of sample 1 (s
x
1
> 0)
n
1
: size of sample 1 (positive integer)
s
x
2
: sample standard deviation of sample 2 (s
x
2
> 0)
n
2
: size of sample 2 (positive integer)
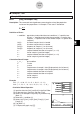
Calculation Result Output
σ
1
x
σ
2
: test condition
F
:
F
value
p
:
p
-value
M
1
: sample mean of sample 1 data (Displayed only for list format.)
M
2
: sample mean of sample 2 data (Displayed only for list format.)
s
x
1
: sample standard deviation of sample 1
s
x
2
: sample standard deviation of sample 2
n
1
: size of sample 1
n
2
: size of sample 2
Example
list1 : { 7, −4, 18, 17, −3, −5, 1, 10, 11, −2, −3 }
list2 : { −1, 12, −1, −3, −3, 3, −5, 5, 2, −11, −1, −3 }
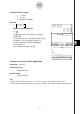
• Statistics Wizard Operation
(1) Input the data into [list1] and [list2] in the Stat Editor.
(2) On the menu bar, tap [Calc] and then [Test].
(3) Select [Two-Sample FTest] and [List], and then tap
[Next >>].
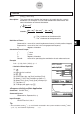
(4) Select the
σ
1
condition [
x
].
(5) Select List(1) [list1], List(2) [list2], Freq(1) [1] and
Freq(2) [1].
(6) Tap [Next >>].
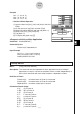
(7) To display the graph, tap
.
F =
s
x1
2
s
x2
2
F =
s
x1
2
s
x2
2