
User Manual

20060301
14-3-2
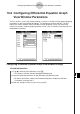
Graphing a Second Order Differential Equation
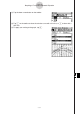
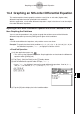
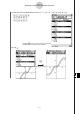
(4) Tap
.
• This draws the phase plane of
x
’ =
x
,
y
’ = −
y
.
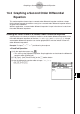
Inputting Initial Conditions and Graphing the Solution Curve of a Second
Order Differential Equation
You can use the procedure in this section to overlay, onto the slope field, solution curve of
the second order differential equation input on the [DiffEq] tab for given initial conditions.
Example: To input the second order differential equation {
x
’ =
x
,
y
’ = −
y
}, draw the phase
plane, and then graph the solution curve of the initial condition (
xi
,
yi
) = (1, 1)
The independent variable minimum value (
t
min) = −7.7, maximum value (
t
max) =
7.7, and initial value (
t
0) = 0.
S
ClassPad Operation
(1) Use the procedure under “Drawing the Phase Plane of a Second Order Differential
Equation” on page 14-3-1 to draw the phase plane for {
x
’ =
x
,
y
’ = −
y
}.
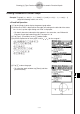
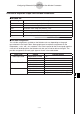
(2) Activate the Differential Equation Editor window and then tap the [IC] tab.
• This displays the initial condition editor.
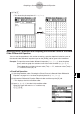
(3) Input (
xi
,
yi
) = (1, 1) into the initial condition editor.
Select the check box next to “
xi
=” and then tap
@
U
@
U
.
2
[Edit] - [Redraw]