
User Manual

20090601
Example
Trials : 5
Specified trial : 3
Probability of success : 0.63
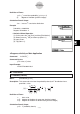
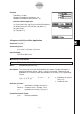
• Statistics Wizard Operation
(1) On the menu bar, tap [Calc] and then [Distribution].
(2) Select [Binomial PD] and then tap [Next >>].
(3) Input values.
(4) Tap [Next >>].
(5) To display the graph, tap
.
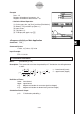
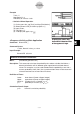
S
Program, eActivity or Main Application
Command: BinomialPD
:
Command Syntax
x
value, Numtrial value,
pos
value
Input Example:
BinomialPD 3,5,0.63
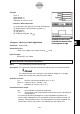
Binomial Cumulative Distribution
Menu: [Distribution]-[Binomial CD]
Description: This command calculates the probability the random variable that follows a
binomial distribution will fall between given upper bound and lower bound
values. For example, it can be used to determine the probability a test with a
success probability of 0.5 (50%) that is performed ten times will be successful
at least three times but no more than five times.
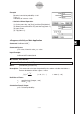
Definition of Terms
Lower : lower bound (Lower
Upper integer)
Upper : upper bound (Lower
Upper integer)
Numtrial : number of trials
n
(integer,
n
1
)
pos
: probability of success
p
(0
p
1)
Calculation Result Output
prob
: binomial cumulative probability
Graphing may take a long
time when the absolute value
of the argument is large.
Graphing may take a long
time when the absolute value
of the argument is large.
7-11-15
Distributions