
User manual - CP330PLUSver310_Soft


20060301
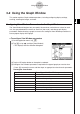
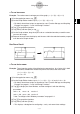
Example 2: To input the function
r
= 3sin2 into line 2 of Sheet 1 and graph it
In Example 1, we graphed a rectangular expression in the form of
y
=
f
(
x
). You can also input
polar coordinate expressions, inequalities, and other types of functions for graphing as well.
In this example, we input and graph the polar coordinate expression
r
= 3sin2 . Note that
the following sample procedure assumes that you have already completed the steps for
Example 1.
u
ClassPad Operation
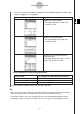
(1) Tap anywhere inside of the Graph Editor window to make it active.
(2) Tap the down arrow next to “
y
=”, or on the menu tap [Type]. On the list that appears,
tap “
r
=”.
• This causes the line numbers next to any line on the Graph Editor window that does
not contain an expression to change from “
y
” to “
r
” (
r
2,
r
3, etc.). The line numbers of
lines that already contain expressions do not change.
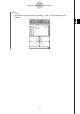
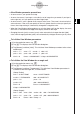
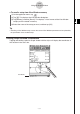
(3) Tap the input box to the right of line number
r
2 and input the expression.
k
9
d
T
s
c
8
)
w
• Tapping
w
stores the expression you input and puts a check mark into the check
box to the left of line number
r
2. When a line number has a check mark next to it, it
means that the expression is currently selected for graphing.
3-1-10
Graph & Table Application Overview
θ
θ