
User manual - CP330PLUSver310_Soft

20060301
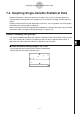
7-4-3
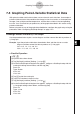
Graphing Single-Variable Statistical Data
k
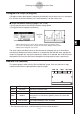
Graph Parameter Settings (page 7-3-3, 7-3-4)
• [XList] specifies the list that contains the data to be plotted.
• [Freq] specifies the frequency of the data.
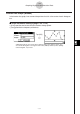
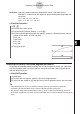
• If [Show Outliers] box is checked, “outlier” square symbols are shown instead of “whisker”
lines where a data value is relatively large or small compared to the other data values.
Tip
• When specifying a list of frequency values, make sure that the list contains positive integers only.
Non-integer values (such as those with a decimal part) cause an error during statistical
calculations.
Normal Distribution Curve (NDist)
The normal distribution curve is graphed using the following normal distribution function.
y
=
1
2 πσ
n
e
–
2σ
n
2
(
x–
x
)
2
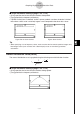
Figure. Do not show Outliers Figure. Show Outliers
k
Graph Parameter Settings (page 7-3-3, 7-3-4)
• [XList] specifies the list that contains the data to be graphed.
• [Freq] specifies the frequency of the data.