
User Manual

1-2
E-CON3 Application Overview
k
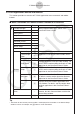
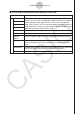
Sensor Setup Window
This window is for selecting a sensor for each of the Data Logger channels to be used for
sampling, and for configuring sampling parameters. The Sensor Setup window has two tabs.
Use this tab: When you want to do this:
Single Configure sampling parameters for a single probe
Multiple Configure parameters for simultaneous sampling with up to three probes
k
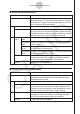
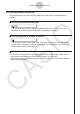
E-CON Graph Editor Window
This window displays the “current data”, which is data that is stored temporarily for each
channel following a sampling operation. The E-CON Graph Editor window has three tabs.
Use this tab: When you want to do this:
Current View current data
Normal
Recall saved sample data without losing the current data
Compare
You can configure separate graph settings for each of the above tabs. After selecting one of
the tabs, you can then change to the E-CON Graph window and graph its data.
k
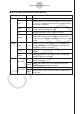
E-CON Graph Window
The E-CON Graph window graphs sampled data in accordance with the settings configured
with the E-CON Graph Editor window. You can use the E-CON Graph window to analyze
a graph be zooming it, by performing Fourier series expansion, by obtaining a periodic
frequency, and more. You can also save the data for a specific range of the graph as list data
or matrix data.
k
Multimeter Window
The Multimeter window provides real-time display of all channel measurement values during
sampling. Displaying this window while the [Single] tab is active on the Sensor Setup window
displays the measurement values of the CH1 or SONIC channel.
When the [Multiple] tab is active, this window shows individual values for all channels that
are being used for sampling.