
User Manual

1-5
E-CON3 Application Overview
k
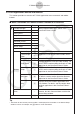
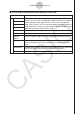
E-CON Graph Window Menus and Buttons
Menu/Command Button Functions
Zoom All Zoom
b
Zooms all currently displayed graphs.
Auto —
Resizes the
y
-axis so the entire graph fits in the screen.
The
x
-axis is adjusted automatically in accordance with
the number of samples.
y
Auto
R
Resizes the graph so all of it fits in the screen along the
y
-axis, without changing the
x
-axis.
Full — Resizes the graph so all of it fits in the screen.
Original —
Resizes the
y
-axis in accordance with the sampling range
of the sensor being used for sampling, and resizes the
x
-axis to a size that allows display of all data on the same
screen.
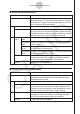
Analysis
Trace
=
Displays a cross-shaped trace cursor. The cursor keys
can be used to move the trace cursor along the graph
and obtain coordinate readings.
Period
m
Calculates the periodic frequency for a range specified on
a graph.
Fourier —
Uses Fourier series expansion to convert a displayed
waveform graph to a function.
File
Save List
All
Stores all of the sample data of the currently displayed
graph as list data.
Select
Stores the sample data in the range selected on the
currently displayed graph as list data.
Save Matrix
All Displays all sample data as matrix data.
Select
Displays the currently selected range of sample data as
matrix data.