
User Manual

Chapter 3: Graph & Table Application 13
Chapter 3:
Graph & Table Application
0301
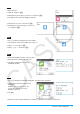
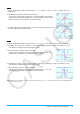
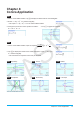
1. On the a menu, tap [Draw Shade].
2. On the dialog box that appears, input the
following: Lower Func:
x
2
– 1, Upper Func:
–x
2
+ 1.
Leave x min and x max blank.
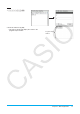
3. Tap [OK].
0302
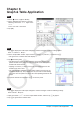
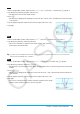
1. Tap 8 to display the Table Input dialog box, and then configure it with the settings below.
Start: –4.9, End: 7.1, Step: 2
2. On the Graph Editor window, input and store
y = 3log(x + 5) into line y1, and then tap #.
• This generates a number table and displays it.
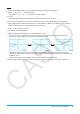
3. Tap a and then [Link].
• This displays the Graph window and draws the graph, with the trace
pointer located on the graph line. The coordinates of the trace pointer
location will also be shown.
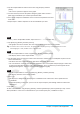
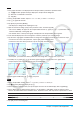
• Tapping a cell in the
y1 column causes the trace pointer to move the
location of the cell’s value.
• You can move the highlighting in the number table by pressing the up
and down cursor keys, or by tapping the cell you want to select. Doing
so causes the trace pointer to jump to the corresponding location on the
graph.
4. To quit the linked trace operation, tap l on the icon panel.
0303
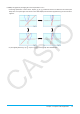
1. Tap 8 to display the Table Input dialog box, and then configure it with the following settings.
Start: 0, End: 1, Step: 0.2
2. Input the function
y = x
3
– 3x on the Graph Editor window, and then tap $ to graph it.
3. Tap # to generate the number table.