
User Manual

Chapter 3: Graph & Table Application 16
0309
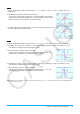
1. On the Graph Editor window, input and store y = x (x + 2)(x – 2) into line y1, and then tap $ to graph it.
2. Tap [Analysis], [G-Solve], [Integral], and then [∫
dx].
• This displays “Lower” on the Graph window.
3. Press 1.
• This displays a dialog box for inputting an interval for the
x-values, with 1 specified for the lower limit of the
x-axis (Lower).
4. Tap the [Upper] input box and then input 2 for the upper limit of the
x-axis.
5. Tap [OK].
0310
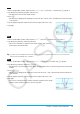
1. On the Graph Editor window, input and store y = x
3
– 1 into line y1, and then tap $ to graph it.
2. Tap [Analysis], [G-Solve], and then [Inflection].
• This causes “Inflection” to appear on the Graph window, with a pointer
located at the point of inflection.
Tip: If your function has multiple inflection points, use the cursor keys or graph controller arrows to move the pointer
between them and display their coordinates.
0311
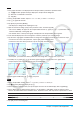
1. On the Graph Editor window, input and store y = x
2
– x – 2 into line y1, and then tap $ to graph it.
2. Tap [Analysis], [G-Solve], and then [π ∫
f(x)
2
dx].
• This displays a crosshair pointer on the graph, and the word “Lower” in the lower right corner of the Graph
window.
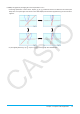
3. Press 1.
• This displays a dialog box for inputting an interval of values for
x, with 1 specified for the lower limit of the
x-axis (Lower).
4. Tap the [Upper] input box and then input 2 for the upper limit of the
x-axis.
5. Tap [OK].
• This causes a silhouette of the solid of revolution to appear on the Graph
window, and its volume to appear in the message box.