
User Manual

Chapter 5: Differential Equation Graph Application 23
0506
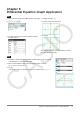
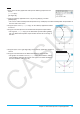
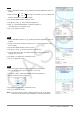
1. On the Differential Equation Editor
window, tap the [Graphs] tab.
2. Tap [Type] - [
f ( x)] or d, and then input
y = x
2
and y = −x
2
.
3. Tap O.
• This will overlay the graphs of
y = x
2
and y = −x
2
on the differential equation
graph.
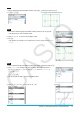
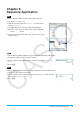
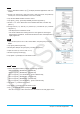
0507
1. On the Differential Equation Editor window, tap the [Graphs] tab.
2. Confirm that “Rad” is displayed as the angle unit setting on the left side of
the status bar. If it isn’t, tap the angle setting until “Rad” is displayed.
3. Tap [Type] - [Parametric] or g, and then input the expression for the graph
xt = 3sin(t) + 1 and yt = 3cos(t) + 1, and 0 s t s 2π for the range of t.
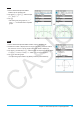
4. Tap O to draw the graph.
• To adjust the graph window, tap [Zoom] and then [Quick Initialize].