
User Manual

Chapter 6: Sequence Application 27
0604
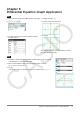
1. On the Sequence Editor window, tap the [Recursive] tab.
2. Tap [Type] - [
a
n
+1
Type a
1
].
3. Input the recursion expression
a
n
+1
= 2a
n
+ 1 and the initial values a
1
= 1.
4. Tap the down arrow button next to #, and then select + to create the table.
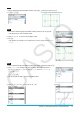
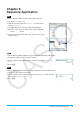
5. Tap 6, configure View Window settings as shown below, and then tap [OK].
xmin = 0 xmax = 6 xscale = 1 xdot: (Specify auto setting.)
ymin = –15 ymax = 65 yscale = 5 ydot: (Specify auto setting.)
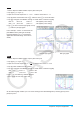
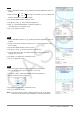
6. Tap $ to draw a connect type graph, or tap
! to draw a plot type graph.
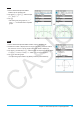
In this example, “4 Cells” is selected for the
[Cell Width Pattern] setting of the Graph
Format dialog box (see “1-7 Configuring
Application Format Settings” in the User’s
Guide).
Connect type graph Plot type graph
0605
1. On the Sequence Editor window, tap the [Recursive] tab.
2. Tap [Type] - [a
n
+1
Type a
1
].
3. Input the recursion expression
a
n
+1
=
− 1 and the initial values a
1
= 0.5.
4. Tap the Table window to make it active.
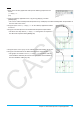
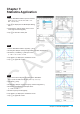
5. Tap 6, configure View Window settings as shown below, and then tap [OK].
xmin = −1.2 xmax = 1 xscale = 0.2
ymin = −1 ymax = 0.1 yscale = 0.2
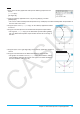
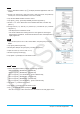
6. Tap w to start drawing a cobweb diagram.
7. Press E for each step of the web.
On the cobweb graph window, you can restart drawing of the cobweb diagram by selecting [Trace] on the
[Analysis] menu.