
User Manual

Chapter 7: Statistics Application 30
0707
1. On the Stat Editor window, tap ~ to display the Main application work area
window.
2. Assign {113,116} to list1, {139,132} to list2, {133,131} to list3, and {126,122}
to list4 (see “2-4 List Calculations” in the User’s Guide).
3. Tap the Stat Editor window to make it active.
4. Tap [Calc] - [Test] - [Two-Way ANOVA] and then tap [Next>>].
5. Select “2 × 2” as the dimensions of the ANOVA data table, and then tap
[Next>>].
6. Assign list1 for (1,1), list2 for (1,2), list3 for (2,1), and list4 for (2,2), and then
tap [Next>>].
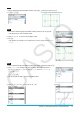
• This displays the calculation results.
• The results indicate that altering the time is not significant, altering the
temperature is significant, and interaction between time and temperature is
highly significant.
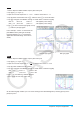
0708
1. Input the data {299.4, 297.7, 301, 298.9, 300.2, 297} into [list1] in the Stat
Editor.
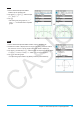
2. Tap [Calc] and then [Interval].
3. Select [One-Sample Z Int] and [List], and then tap [Next>>].
4. Input the values (C-Level = 0.95, σ = 3).
5. Select List [list1] and Freq [1].
6. Tap [Next >>] to display the calculation results.
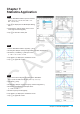
0709 to 0714
1. On the Stat Editor window, perform the following operation:
0709: Tap [Calc] - [Distribution] - [Normal PD]
0710: Tap [Calc] - [Distribution] - [Normal CD]
0711: Tap [Calc] - [Inv. Distribution] - [Inverse Normal CD]
0712: Tap [Calc] - [Distribution] - [Poisson PD]
0713: Tap [Calc] - [Distribution] - [Poisson CD]
0714: Tap [Calc] - [Inv. Distribution] - [Inverse Poisson CD]
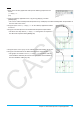
2. Tap [Next >>], and then input values.
3. Tap [Next >>] to display the calculation results.
4. Tap $ to graph the results (except for
0714 ).
• See the next page of this manual for the calculation result and graph screen.