
User Manual

Chapter 13: Spreadsheet Application 44
Chapter 13:
Spreadsheet Application
1301
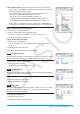
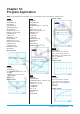
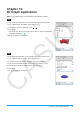
1. On the Spreadsheet window, input the data
and then select input range cells A1:C5.
2. Tap [Calc] - [Test] - [Linear Reg
t-Test], and
then tap [Next>>].
• This will automatically insert the cell
references into the fields as shown in the
nearby screen shot.
3. Tap [Next>>].
4. Tap $ to draw the linear regression graph.
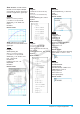
1302
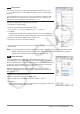
1. On the Spreadsheet window, input the data
and then select input range cells A1:D2.
2. Tap [Calc] - [Test] - [Two-Way ANOVA], and
then tap [Next>>].
3. Select “2 × 2” as the dimensions of the
ANOVA data table, and then tap [Next>>].
4. After confirming that cell references have
been automatically inserted into the fields
as shown in the nearby screen shot, tap
[Next>>].
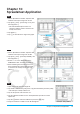
1303
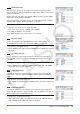
1. Input values into cells A1 through A5.
2. Tap cell B1. Next, on the [Calc] menu, tap [Cell-Calculation] and then [cellIf].
• This will input “=cellif(” into the cell.
3. Tap A1 to input the cell reference “A1”.
4. Tap the edit box and then use the soft keyboard to input the rest of the
expression.
5. Tap the s button next to the edit box or press the E key.
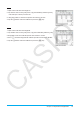
6. Copy the contents of cell B1 to cells B2 through B5.
=cellif(A1>5,"Big","Small")