
User Manual


Chapter 14: 3D Graph Application 46
Chapter 14:
3D Graph Application
Note: The example below uses initial default View Window settings.
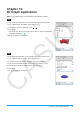
1401
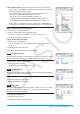
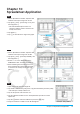
1. In the 3D Graph application, make the 3D Graph Editor window active.
2. If x is displayed on the toolbar, tap to toggle it to z.
3. In a blank line (
z5 in this example), input
x
2
2
–
y
2
8
.
4. Press E.
• This stores the expression you input and selects it, which is indicated by
the button changing to “
”.
5. Tap 7 to graph the expression.
1402
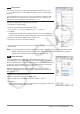
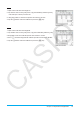
1. In the 3D Graph application, make the 3D Graph Editor window active.
2. If z is displayed on the toolbar, tap to toggle it to x.
3. In a blank Xst line (Xst6 in this example), input 3sin(
t) × cos(s).
4. In the Yst line immediately under the Xst line, input 3cos(
t) × cos(s).
5. In the Zst line immediately under the Yst line, input sin(
s).
6. Press E.
7. Tap 7 to graph the expression.