
User`s guide

20031201
8-1
Graphing Data
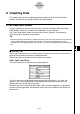
8 Graphing Data
This chapter explains how to configure graph parameters on the E-Con Graph Editor
window, and how to draw a graph on the E-Con Graph window.
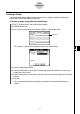
E-Con Graph Editor Window
To graph sample data, you first need to tap the c button and display the E-Con Graph
Editor window, where you can select the sample data you want to graph.
The E-Con Graph Editor window has three tabs: [Current], [Normal], and [Compare].
Each of the tabs is described in detail below.
Tip
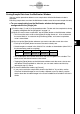
• Note that each time you perform a sampling operation, all of the current data on the [Current] tab
(or the sampled data you recalled for each graph) is cleared and replaced with the newly
sampled data. A sampling operation does not have any affect on the [Normal] tab and [Compare]
tab.
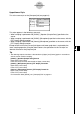
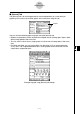
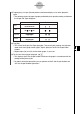
k [Current] Tab
The [Current] tab shows the current data (page 5-5). Use this tab when you want to draw a
graph of the current data following a sampling operation.
The [Current] tab can be either of the two styles shown below.
Gph1, Gph2, Gph3 Style
This is the same style as the [Normal] tab (see page 8-3).
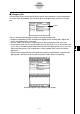
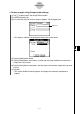
This is the style that is displayed following sampling with most sensors. This style also
appears if you have not performed a sampling operation to produce current data, and
following the Clear All operation (page 8-10).
Except for the fact that the [Current] tab Gph1, Gph2, and Gph3 graph data is replaced by
the latest sampling operation, the operations for this tab style are identical to those for the
[Normal] tab.
20040201