Chapter Statistical Graphs and Calculations This chapter describes how to input statistical data into lists, and how to calculate the mean, maximum and other statistical values. It also tells you how to perform regression calculations. 1. 2. 3. 4. 5. 6.
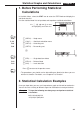
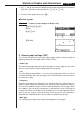
Statistical Graphs and Calculations Chapter 7 1. Before Performing Statistical Calculations In the Main Menu, select the STAT icon to enter the STAT Mode and display the statistical data lists. Use the statistical data lists to input data and to perform statistical calculations. Use f, c, d and e to move the highlighting around the lists. P.95 P.113 1 2 3 4 [ 1 2 3 4 1 (GRPH) .... Graph menu 2 (CALC) ..... Statistical calculation menu P.83 3 (SRT•A) .... Ascending sort P.84 4 (SRT•D) ...
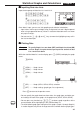
Statistical Graphs and Calculations Chapter 7 k Inputting Data into Lists Input the two groups of data into List 1 and List 2. a.fwb.cw c.ewewf.cw e -c.bwa.dw b.fwcwc.ew Once data is input, you can use it for graphing and statistical calculations. • Input values can be up to 10 digits long (9-digit mantissa and 2-digit exponent when using exponential format). Values in statistical data table cells are shown only up to six digits.
Statistical Graphs and Calculations Chapter 7 k Plotting a Scatter Diagram It is often difficult to spot the relationship between two sets of data (such as height and shoe size) by simply looking at the numbers. Such relationships often become clear however, when we plot the data on a graph, using one set as x-values and the other set as y-values.
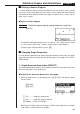
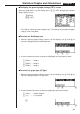
Statistical Graphs and Calculations Chapter 7 2. Use f and c to move the highlighting to the graph whose draw (On)/non-draw (Off) status you want to change and press 1 (On) or 2 (Off). 3. To return to the graph menu, press Q. u To draw a graph Example To draw a scatter diagram of Graph 3 only 1(GRPH)[1(SEL) 2(Off) cc1(On) 1 2 3 4 4(DRAW) 2.
Statistical Graphs and Calculations Chapter 7 u To display the general graph settings (SET) screen While the graph menu is on the display, press [4 (SET) to display the general graph settings screen. 1(GRPH) [4(SET) • The settings shown here are examples only. The settings on your general graph settings screen may differ. u To select the StatGraph area 1. While the general graph settings screen is on the display, use f and c to move the highlighting to the StatGraph item. 1 2 3 4 2.
Statistical Graphs and Calculations Chapter 7 1 (Hist) ........ Histogram (bar graph) 2 (Box) ........ Med-box graph 3 (N•Dis) ..... Normal distribution curve [ 1 2 3 4 [ 1 2 3 4 [ 1 (X) ............ Linear regression graph 2 (Med) ....... Med-Med graph 3 (X^2) ........ Quadratic regression graph [ 1 (Log) ........ Logarithmic regression graph 2 (Exp) ........ Exponential regression graph 3 (Pwr) ........ Power regression graph Press [ to return to the previous menu.
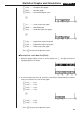
Statistical Graphs and Calculations Chapter 7 u To select the y-axis data list (YList) 1. While the graph settings screen is on the display, use f and c to move the highlighting to the YList item. 1 2 3 4 [ 2. Use the function key menu to select the name of the statistical data list whose values you want on the y-axis of the graph. 1 (List1) ....... List 1 2 (List2) ....... List 2 3 (List3) ....... List 3 4 (List4) ....... List 4 [ 1 (List5) ....... List 5 1 2 3 4 [ 2 (List6) .......
Statistical Graphs and Calculations Chapter 7 1 (List4) ....... List 4 data is frequency data. 2 (List5) ....... List 5 data is frequency data. 3 (List6) ....... List 6 data is frequency data. Press [ to return to the previous menu. u To select the plot mark type (M-Type) 1. While the general graph settings screen is on the display, use f and c to move the highlighting to the M-Type item. 1 2 3 4 2. Use the function key menu to select the plot mark you want to select. 1 ( ) ...........
Statistical Graphs and Calculations Chapter 7 [ 1 2 3 4 [ 1 (Log) ........ Logarithmic regression graph 2 (Exp) ........ Exponential regression graph 3 (Pwr) ........ Power regression graph 4 (2VAR) ..... Paired-variable statistical results Press [ to return to the previous menu. k Displaying Statistical Calculation Results Whenever you perform a regression calculation, the regression formula parameter (such as a and b in the linear regression y = ax + b) calculation results appear on the display.
Statistical Graphs and Calculations Example Chapter 7 To graph a logarithmic regression While logarithmic regression parameter calculation results are on the display, press 4 (DRAW). 4(DRAW) P.101 For details on the meanings of function menu items at the bottom of the display, see “Selecting the Regression Type”. 3. Calculating and Graphing SingleVariable Statistical Data Single-variable data is data with only a single variable.
Statistical Graphs and Calculations Chapter 7 k Normal Distribution Curve The normal distribution curve is graphed using the following normal distribution function. y= P.99 (G-Type) (N•Dis) 1 (2 π) xσn e – (x–x) 2 2xσn 2 The distribution of characteristics of items manufactured according to some fixed standard (such as component length) fall within normal distribution. The more data items there are, the closer the distribution is to normal distribution.
Statistical Graphs and Calculations Chapter 7 The following describes the meaning of each of the parameters. _ x ..................... Mean of data Σ x ................... Sum of data Σ x2 .................. Sum of squares xσn .................. Population standard deviation xσn-1 ................ Sample standard deviation n ..................... Number of data items minX ............... Minimum Q1 .................. First quartile Med ................ Median Q3 .................. Third quartile maxX ...
Statistical Graphs and Calculations Chapter 7 The following are the meanings of the above parameters. a ...... Regression coefficient (slope) b ...... Regression constant term (intercept) r ...... Correlation coefficient k Med-Med Graph P.99 (G-Type) When it is suspected that there are a number of extreme values, a Med-Med graph can be used in place of the least squares method. This is also a type of linear regression, but it minimizes the effects of extreme values.
Statistical Graphs and Calculations Chapter 7 4(DRAW) The following are the meanings of the above parameters. a ...... Regression second coefficient b ...... Regression first coefficient c ...... Regression constant term (intercept) k Logarithmic Regression Graph P.99 (G-Type) Logarithmic regression expresses y as a logarithmic function of x. The standard logarithmic regression formula is y = a + b × logx, so if we say that X = log x, the formula corresponds to linear regression formula y = a + bX.
Statistical Graphs and Calculations Chapter 7 [2(Exp) 1 2 3 4 4(DRAW) The following are the meanings of the above parameters. a ...... Regression coefficient b ...... Regression constant term r ...... Correlation coefficient k Power Regression Graph P.99 (G-Type) Exponential regression expresses y as a proportion of the power of x. The standard power regression formula is y = a × xb, so if we take the logarithms of both sides we get logy = loga + b × logx.
Statistical Graphs and Calculations Chapter 7 The following are the meanings of the above parameters. a ...... Regression coefficient b ...... Regression power r ...... Correlation coefficient k Displaying Paired-Variable Statistical Results P.102 (G-Type) Paired-variable statistics can be expressed as both graphs and parameter values. When these graphs are displayed, the menu at the bottom of the screen appears as below. [ 1 2 3 4 4(2VAR) ......
Statistical Graphs and Calculations Chapter 7 k Copying a Regression Graph Formula to the Graph Mode After you perform a regression calculation, you can copy its formula to the GRAPH Mode. The following are the functions that are available in the function menu at the bottom of the display while regression calculation results are on the screen. 1 2 3 4 3 (COPY) .... Stores the displayed regression formula to the GRAPH Mode 4 (DRAW).... Graphs the displayed regression formula 1.
Statistical Graphs and Calculations Chapter 7 4(DRAW) P.101 1(X) • The text at the top of the screen indicates the currently selected graph (STAT Graph 1 = Graph 1, STAT Graph 2 = Graph 2, STAT Graph 3 = Graph 3). 1. Use f and c to change the currently selected graph. The graph name at the top of the screen changes when you do. c 2. When graph you want to use is selected, press w. P.104 P.
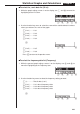
Statistical Graphs and Calculations Chapter 7 While the statistical data list is on the display, perform the following procedure. !Z 1 2 3 4 2(Man) Q(Returns to previous menu.) 1(GRPH)1(GPH1) Here we will illustrate this operation by making histogram settings for Graph 1. The following are the meanings of the items that appear in this screen. Strt.................. Histogram start point ( x-coordinate) ptch ................
Statistical Graphs and Calculations Chapter 7 6. Performing Statistical Calculations All of the statistical calculations up to this point were performed after displaying a graph. The following procedures can be used to perform statistical calculations alone. u To specify statistical calculation data lists You have to input the statistical data for the calculation you want to perform and specify where it is located before you start a calculation.
Statistical Graphs and Calculations Chapter 7 k Paired-Variable Statistical Calculations In the previous examples from “Linear Regression Graph” to “Power Regression Graph,” statistical calculation results were displayed after the scatter diagram was drawn. These were numeric expressions of the characteristics of variables used in the graphic display. The following operation produces the same values directly from the statistical data list.
Statistical Graphs and Calculations Chapter 7 k Estimated Value Calculation ( , ) After drawing a regression graph with the STAT Mode, you can use the RUN Mode to calculate estimated values for the regression graph's x and y parameters. • Note that you cannot obtain estimated values for Med-Med graph and quadratic regression graph.
Statistical Graphs and Calculations The estimated value Chapter 7 is displayed for xi = 40. baaa(value of yi) 1( )w The estimated value is displayed for yi = 1000.