Chapter Statistical Graphs and Calculations This chapter describes how to input statistical data into lists, and how to calculate the mean, maximum and other statistical values. It also tells you how to perform regression calculations. 1. 2. 3. 4. 5. 6.
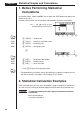
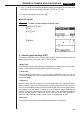
Chapter 7 Statistical Graphs and Calculations 1. Before Performing Statistical Calculations In the Main Menu, select the STAT icon to enter the STAT Mode and display the statistical data lists. Use the statistical data lists to input data and to perform statistical calculations. Use f, c, d and e to move the highlighting around the lists. P.97 1 (GRPH) .... Graph menu P.121 2 (CALC) ..... Statistical calculation menu P.85 3 (SRT•A) .... Ascending sort P.86 4 (SRT•D) ....
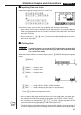
Statistical Graphs and Calculations Chapter 7 k Inputting Data into Lists Input the two groups of data into List 1 and List 2. a.fwb.cw c.ewewf.cw e -c.bwa.dw b.fwcwc.ew Once data is input, you can use it for graphing and statistical calculations. • Input values can be up to 10 digits long (9-digit mantissa and 2-digit exponent when using exponential format). Values in statistical data table cells are shown only up to six digits.
Chapter 7 Statistical Graphs and Calculations k Plotting a Scatter Diagram It is often difficult to spot the relationship between two sets of data (such as height and shoe size) by simply looking at the numbers. Such relationships often become clear however, when we plot the data on a graph, using one set as x -values and the other set as y-values.
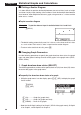
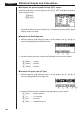
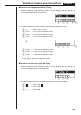
Statistical Graphs and Calculations Chapter 7 2. Use f and c to move the highlighting to the graph whose draw (On)/non-draw (Off) status you want to change and press 1 (On) or 2 (Off). 3. To return to the graph menu, press Q. uTo draw a graph Example To draw a scatter diagram of Graph 3 only 1(GRPH)[1(SEL) 2(Off) cc1(On) 1 2 3 4 4(DRAW) 2.
Chapter 7 Statistical Graphs and Calculations uTo display the general graph settings (SET) screen While the graph menu is on the display, press [4 (SET) to display the general graph settings screen. 1(GRPH) [4(SET) • The settings shown here are examples only. The settings on your general graph settings screen may differ. uTo select the StatGraph area 1. While the general graph settings screen is on the display, use f and c to move the highlighting to the StatGraph item. 1 2 3 4 2.
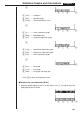
Statistical Graphs and Calculations Chapter 7 [ 1 2 3 4 [ 1 2 3 4 [ 1 2 3 4 [ 1 2 3 4 [ 1 (Hist) ......... Histogram 2 (Box) ......... Med-box graph 3 (N•Dis) ...... Normal distribution curve [ 1 (X) ............ Linear regression graph 2 (Med) ........ Med-Med graph 3 (X^2) ......... Quadratic regression graph [ 1 (Log) ......... Logarithmic regression graph 2 (Exp) ......... Exponential regression graph 3 (Pwr) ......... Power regression graph [ 1 (Bar) .........
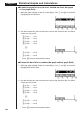
Chapter 7 Statistical Graphs and Calculations 2. Use the function key menu to select the name of the statistical data list whose values you want on the x -axis of the graph. 1 (List1) ....... List 1 2 (List2) ....... List 2 3 (List3) ....... List 3 4 (List4) ....... List 4 [ 1 (List5) ....... List 5 1 2 3 4 [ 2 (List6) ....... List 6 Press [ to return to the previous menu. uTo select the y-axis data list (YList) 1.
Statistical Graphs and Calculations Chapter 7 uTo select the frequency data list (Freq) 1. While the general graph settings screen is on the display, use f and c to move the highlighting to the Freq item. 1 2 3 4 [ 2. Use the function key menu to select the frequency setting you want. 1 (1) ............. Plot all data (1-to-1) 2 (List1) ....... List 1 data is frequency data. 3 (List2) ....... List 2 data is frequency data. 4 (List3) ....... List 3 data is frequency data. [ 1 2 3 4 [ 1 (List4) ...
Chapter 7 Statistical Graphs and Calculations u To select the data list for a pie chart, stacked bar chart, bar graph or line graph (Data) 1. While the graph settings screen is on the display, use f and c to move the highlighting to the Data item. 1 2 3 4 [ 2. Use the function key menu to select the name of the statistical data list whose values you want to use. 1 (List1) ....... List 1 2 (List2) ....... List 2 3 (List3) ....... List 3 4 (List4) ....... List 4 [ 1 (List5) .......
Statistical Graphs and Calculations Chapter 7 3. Use f and c to move the highlighting to the Line item. 1 2 3 4 [ 4. Use the function key menu to select the name of the statistical data list whose values you want to use. 1 (List1) ....... List 1 2 (List2) ....... List 2 3 (List3) ....... List 3 4 (List4) ....... List 4 [ 1 (List5) ....... List 5 1 2 3 4 [ 2 (List6) ....... List 6 Press [ to return to the previous menu. k Drawing an xy Line Graph P.
Chapter 7 Statistical Graphs and Calculations [ 1 2 3 4 1 (Log) ......... Logarithmic regression 2 (Exp) ......... Exponential regression 3 (Pwr) ......... Power regression 4 (2VAR) ...... Paired-variable statistical results Press [ to return to the previous menu. k Displaying Statistical Calculation Results Whenever you perform a regression calculation, the regression formula parameter (such as a and b in the linear regression y = ax + b ) calculation results appear on the display.
Statistical Graphs and Calculations Example Chapter 7 To graph a logarithmic regression While logarithmic regression parameter calculation results are on the display, press 4 (DRAW). 4(DRAW) P.105 For details on the meanings of function menu items at the bottom of the display, see “Selecting the Regression Type”. 3. Calculating and Graphing SingleVariable Statistical Data Single-variable data is data with only a single variable.
Chapter 7 Statistical Graphs and Calculations Q1 Med Q3 minX maxX k Normal Distribution Curve The normal distribution curve is graphed using the following normal distribution function. y= P.101 (G-Type) (N•Dis) 1 (2 π) xσn e – (x – x) 2 2xσn 2 The distribution of characteristics of items manufactured according to some fixed standard (such as component length) fall within normal distribution. The more data items there are, the closer the distribution is to normal distribution.
Statistical Graphs and Calculations Chapter 7 The following describes the meaning of each of the parameters. _ x ...................... Mean of data Σx .................... Sum of data Σx 2 .................. Sum of squares xσn .................. Population standard deviation xσn -1 ................ Sample standard deviation n ...................... Number of data items minX ................ Minimum Q1 ................... First quartile Med ................. Median Q3 ...................
Chapter 7 Statistical Graphs and Calculations • Performing a trace operation (!1 (TRCE)) while a pie chart is on the display causes the pointer to appear at the topmost segment. Pressing e and d moves the pointer to neighboring segments. • While a pie graph is on the display, you can toggle between the two data formats (percent and data) by pressing !4 (CHNG). • You cannot draw multiple pie charts on the same screen. • Percent values shown on pie charts are cut off to two decimal places.
Statistical Graphs and Calculations Chapter 7 • Only positive data can be included in a stacked bar chart. Attempting to draw a stacked bar chart for a list that includes negative data causes an error (Ma ERROR). • A stacked bar chart cannot be superimposed with another graph. • View Window settings are not applied to stacked bar charts. • The following display shows what happens if you perform a trace operation (! 1 (TRCE)) while a stacked bar chart is on the display.
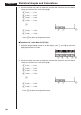
Chapter 7 Statistical Graphs and Calculations Example To input the following data into List 1 and use it to draw a bar graph: 18.0, 13.5, 4.5, 31.5, 22.5 1(GRPH)[4(SET) 1(GPH1)c [[[[1(Bar)c 1(List1)Q 1(GRPH)1(GPH1) • A bar graph can have up to 14 data items. Attempting to draw a bar graph for a list that has more than 14 data items causes an error (Dim ERROR). P.8 • The x-axis of a bar graph is fixed.
Statistical Graphs and Calculations Chapter 7 • Pressing ! 1 (TRCE) while a line graph is on the display activates the trace operation. Use d and e to move the pointer. • You cannot draw multiple line graphs on the same screen. k Bar Graph and Line Graph P.101 (G-Type) (Both) P.8 From the statistical data list, press 1 (GRPH) to display the graph menu, press [4 (SET), and then change the graph type of the graph you want to use (GPH1, GPH2, GPH3) to Both.
Chapter 7 Statistical Graphs and Calculations 4. Calculating and Graphing PairedVariable Statistical Data Under “Plotting a Scatter Diagram,” we displayed a scatter diagram and then performed a logarithmic regression calculation. Let’s use the same procedure to look at the six regression functions. k Linear Regression Graph P.
Statistical Graphs and Calculations Chapter 7 k Med-Med Graph P.105 When it is suspected that there are a number of extreme values, a Med-Med graph can be used in place of the least squares method. This is also a type of linear regression, but it minimizes the effects of extreme values. It is especially useful in producing highly reliable linear regression from data that includes irregular fluctuations, such as seasonal surveys.
Chapter 7 Statistical Graphs and Calculations The following are the meanings of the above parameters. a ...... Regression second coefficient b ...... Regression first coefficient c ...... Regression constant term ( y-intercept) k Logarithmic Regression Graph P.106 Logarithmic regression expresses y as a logarithmic function of x . The standard logarithmic regression formula is y = a + b × logx, so if we say that X = log x, the formula corresponds to linear regression formula y = a + bX.
Statistical Graphs and Calculations Chapter 7 4(DRAW) The following are the meanings of the above parameters. a ...... Regression coefficient b ...... Regression constant term r ...... Correlation coefficient k Power Regression Graph P.106 Exponential regression expresses y as a proportion of the power of x . The standard power regression formula is y = a × x b, so if we take the logarithms of both sides we get logy = loga + b × logx .
Chapter 7 Statistical Graphs and Calculations k Displaying Paired-Variable Statistical Results P.106 Paired-variable statistics can be expressed as both graphs and parameter values. When these graphs are displayed, the menu at the bottom of the screen appears as below. [ 1 2 3 4 4(2VAR) ....... Paired-variable calculation result menu Pressing 4 (2VAR) displays the following screen. 4(2VAR) • Use c to scroll the list so you can view the items that run off the bottom of the screen.
Statistical Graphs and Calculations 1 Chapter 7 2 3 4 3 (COPY) ..... Stores the displayed regression formula to the GRAPH Mode 4 (DRAW) .... Graphs the displayed regression formula 1. Press 3 (COPY) to copy the regression formula that produced the displayed data to the GRAPH Mode. 3(COPY) Note that you cannot edit regression formulas for graph formulas in the GRAPH Mode. 2. Press w to save the copied graph formula and return to the previous regression calculation result display. k Multiple Graphs P.
Chapter 7 Statistical Graphs and Calculations • The text at the top of the screen indicates the currently selected graph (StatGraph 1 = Graph 1, StatGraph 2 = Graph 2, StatGraph 3 = Graph 3). 1. Use f and c to change the currently selected graph. The graph name at the top of the screen changes when you do. c 2. When graph you want to use is selected, press w. P.108 P.
Statistical Graphs and Calculations Chapter 7 2(Man) Q(Returns to previous menu.) 1(GRPH)1(GPH1) Here we will illustrate this operation by making histogram settings for Graph 1. The following are the meanings of the items that appear in this screen. Strt .................. Histogram start point (x -coordinate) ptch ................. Bar spacing (specify as scale unit) Example Strt: 0, ptch: 10 While the statistical data list is on the display, perform the following procedure.
Chapter 7 Statistical Graphs and Calculations The following is the meaning for each item. 1VarX .............. Specifies list where single-variable statistic x values (XList) are located. 1VarF .............. Specifies list where single-variable frequency values (Frequency) are located. 2VarX .............. Specifies list where paired-variable statistic x values (XList) are located. 2VarY .............. Specifies list where paired-variable statistic y values (YList) are located. 2VarF ..............
Statistical Graphs and Calculations Chapter 7 Now you can press f and c to view variable characteristics. P.118 For details on the meanings of these statistical values, see “Displaying Paired-Variable Statistical Results”. k Regression Calculation In the explanations from "Linear Regression Graph" to "Power Regression Graph," regression calculation results were displayed after the graph was drawn. Here, the regression line and regression curve is represented by mathematical expressions.
Chapter 7 Statistical Graphs and Calculations Example To perform power regression using the following data and estimate the values of and when xi = 40 and yi = 1000 xi (List 1) yi (List 2) 28 2410 30 3033 33 3895 35 38 4491 5717 1. In the Main Menu, select the STAT icon and enter the STAT Mode. 2. Input data into the list and draw the power regression graph.