Chapter 4 Graphing A collection of versatile graphing tools plus a large 79 × 47-dot display makes it easy to draw a variety of function graphs quickly and easily. This calculator is capable of drawing the following types of graphs. • Rectangular coordinate (Y =) graphs • Parametric graphs • Inequality graphs • A selection of graph commands also makes it possible to incorporate graphing into programs. 1. 2. 3. 4. 5.
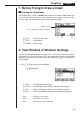
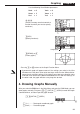
Graphing Chapter 4 1. Before Trying to Draw a Graph k Entering the Graph Mode On the Main Menu, select the GRAPH icon and enter the GRAPH Mode. When you do, the Graph Function (G-Func) menu appears on the display. You can use this menu to store, edit, and recall functions and to draw their graphs. Memory area Use f and c to change selection. 1 2 3 4 1 (SEL) ........ Draw/non-draw status 2 (DEL) ....... Graph delete 4 (DRAW).... Draws graph 2.
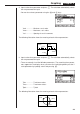
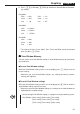
Graphing Chapter 4 2. Input a value for a parameter and press w. The calculator automatically selects the next parameter for input. • You can also select a parameter using the c and f keys. Ymin ............... Minimum y-axis value Ymax .............. Maximum y-axis value Yscl ................ Spacing of y-axis increments The following illustration shows the meaning of each of these parameters. Y max X min (x, y) X scl Y scl X max Y min 3. Input a value for a parameter and press w.
Graphing Chapter 4 4. To exit the View Window, press Q. • Pressing w without inputting any value also exits the View Window. • The following is the input range for View Window parameters. –9.99E+97 to 9.999E+97 • You can input parameter values up to 7 digits long. Values greater than 106 or less than 10-1, are automatically converted to a 4-digit mantissa (including negative sign) plus a 2-digit exponent. • The only keys that enabled while the View Window is on the display are: a to j, .
Graphing Chapter 4 b. Press ! 3 (V-Window) 2 (TRIG) to initialize the View Window to the following settings. Deg Mode Xmin = –360 Ymin = –1.6 Xmax = 360 Ymax = 1.6 Xscl = Yscl = 0.5 90 Rad Mode Xmin = –6.28318 Xmax = 6.28318 Xscl = 1.57079 Gra Mode Xmin = –400 Xmax = 400 Xscl = 100 • The settings for Ymin, Ymax, Ypitch, Tmin, Tmax, and Tpitch remain unchanged when you press 2 (TRIG).
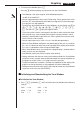
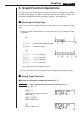
Graphing Chapter 4 3. Graph Function Operations You can store up to 10 functions in memory. Functions in memory can be edited, recalled, and graphed. The types of functions that can be stored in memory are: rectangular coordinate functions, parametric functions, and inequalities. k Specifying the Graph Type Before you can store a graph function in memory, you must first specify its graph type. 1. While the Graph Function Menu is on the display, press [ to display a Graph Type Menu. [ 1 (Y =) .........
Graphing Chapter 4 • You will not be able to store the expression in an area that already contains a parametric function. Select another area to store your expression or delete the existing parametric function first. This also applies when storing inequalities. u To store a parametric function Example To store the following functions in memory areas Xt2 and Yt2: x = 3 sin T y = 3 cos T [2(Parm) (Specifies parametric expression.) dsTw (Inputs and stores x expression.
Graphing Chapter 4 k Editing Functions in Memory u To edit a function in memory Example To change the expression in memory area Y1 from y = 2x2 – 5 to y = 2 x2 – 3 e (Displays cursor.) eeeed (Changes contents.) w (Stores new graph function.) u To delete a function 1. While the Graph Function Menu is on the display, press f or c to display the cursor and move the highlighting to the area that contains the function you want to delete. 2. Press 2 (DEL). 1 2 3 4 3.
Graphing Chapter 4 Use the following View Window parameters. Xmin = –5 Ymin = –5 Xmax = 5 Ymax = 5 Xscl Yscl = 1 = 1 ccc (Select a memory area that contains a function for which you want to specify non-draw.) 1 2 3 4 1 Unhighlights 2 3 4 1(SEL) (Specify non-draw.) 4(DRAW) or w (Draws graphs.) • Pressing u or A returns to the Graph Function Menu.
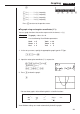
Graphing Chapter 4 [ 1 (Y >) ......... Y > f (x) inequality 1 2 3 4 [ 2 (Y <) ......... Y < f (x) inequality 3 (Y ≥) ......... Y > f (x) inequality 4 (Y ≤) ......... Y < f (x) inequality Press [ to return to the previous menu. u To graph using rectangular coordinates (Y =) You can graph functions that can be expressed in the format y = f (x). To graph y = 2x2 + 3x – 4 Example Use the following View Window parameters. Xmin = –5 Ymin = –10 Xmax = 5 Ymax = 10 Xscl Yscl = 2 = 5 1.
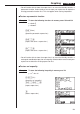
Graphing Chapter 4 u To graph parametric functions You can graph parametric functions that can be expressed in the following format. (X, Y) = ( f (T), g (T)) Example To graph the following parametric functions: x = 7 cos T – 2 cos 3T y = 7 sin T – 2 sin 3T Use the following View Window parameters. Xmin Xmax Xscl Tmin Tptch = –20 = 20 = 5 = 0 = π÷36 Ymin Ymax Yscl Tmax = –12 = 12 = 5 = 2π 1. In the set-up screen, specify the appropriate graph type for F-Type. !Z2(Parm) 2.
Graphing Example Chapter 4 To graph the inequality y > x2 – 2x – 6 Use the following View Window parameters. Xmin = –6 Ymin = –10 Xmax = 6 Ymax = 10 Xscl Yscl = 1 = 5 1. In the set-up screen, specify the appropriate graph type for F-Type. !Z[1(Y>)Q 2. Input the inequality. A!4(SKTCH)1(Cls)w 2(GRPH)[1(Y>) Tx-cT-g 3. Press w to draw the graph. w 5.
Graphing Chapter 4 k Trace With trace, you can move a flashing pointer along a graph with the f, c, d, and e cursor keys and obtain readouts of coordinates at each point. The following shows the different types of coordinate readouts produced by trace.
Graphing Chapter 4 • Pressing d and e moves the pointer along the graph. Holding down either key moves the pointer at high speed. 3. Use f and c to move the pointer between the two graphs. 4. Use e to move the pointer to the other intersection. e~e • To quit the trace operation, press 1 (TRCE) again. uScrolling When the graph you are tracing runs off the display along either the x- or y-axis, pressing the e or d cursor key causes the screen to scroll in the corresponding direction eight dots.
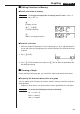
Graphing Example Chapter 4 To graph y = A x2 – 3, substituting 3, 1, and –1 for the value of A Use the following View Window parameters. Xmin = –5 Ymin = –10 Xmax = 5 Ymax = 10 Xscl Yscl = 1 = 2 [1(Y =) (Specifies graph type.) aATx-d, ![aA!=d, 1 2 3 4 b,-b!]w (Stores expression.) 4(DRAW) or w (Draws graph.) ↓ ↓ • The function that is input using the above syntax can have only one variable. • You cannot use X, Y or T as the variable name.
Graphing Chapter 4 k Zoom The zoom feature lets you enlarge and reduce a graph on the display. u Before using zoom Immediately after drawing a graph, press !2 (ZOOM) to display the Zoom Menu. !2(ZOOM) 1 2 3 4 [ 3 4 1 (BOX) ....... Graph enlargement using box zoom 2 (FACT) ..... Displays screen for specification of zoom factors 3 (IN) ........... Enlarges graph using zoom factors 4 (OUT) ....... Reduces graph using zoom factors [ 1 1 (ORIG) .....
Graphing Chapter 4 2. Press 1 (BOX), and then use the cursor keys (d, e, f, c) to move the pointer to the location of one of the corners of the box you want to draw on the screen. Press w to specify the location of the corner. 1(BOX) d ~ dw 3. Use the cursor keys to move the pointer to the location of the corner that is diagonally across from the first corner. f~fd~d 4. Press w to specify the location of the second corner.
Graphing Chapter 4 Use the following View Window parameters. Xmin = –8 Ymin = –30 Xmax = 8 Ymax = 30 Xscl Yscl = 5 = 10 1. After graphing the functions, press !2 (ZOOM), and the pointer appears on the screen. !2(ZOOM) 2. Use the cursor keys (d, e, f, c) to move the pointer to the location that you want to be the center of the new display. d~df~f 1 2 3 4 3. Press 2 (FACT) to display the factor specification screen, and input the factor for the x- and y-axes. 2(FACT) fwfw 4.
Graphing Chapter 4 • The above procedure automatically converts the x-range and y-range View Window values to 1/5 of their original settings. • You can repeat the factor zoom procedure more than once to further enlarge or reduce the graph. u To initialize the zoom factor Press ! 2 (ZOOM) 2 (FACT) 1 (INIT) to initialize the zoom factor to the following settings. Xfct = 2 Yfct = 2 • You can use the following syntax to incorporate a factor zoom operation into a program.
Graphing Chapter 4 [ 1 2 3 4 • Other menu items are identical to those in the STAT, GRAPH, TABLE Mode menu. The Sketch function lets you draw lines and plot points on a graph that is already on the screen. All the examples in this section that show operations in the STAT, GRAPH or TABLE Mode are based on the assumption that the following function has already been graphed in the GRAPH Mode. Memory Area Y1: y = x(x + 2)(x – 2) The following are the View Window parameters used when drawing the graph.
Graphing Chapter 4 In the RUN or PRGM Mode The following is the syntax for plotting points in these modes. Plot < x-coordinate>, Example To plot a point at (2, 2) Use the following View Window parameters. Xmin = –5 Ymin = –10 Xmax = 5 Ymax = 10 Xscl Yscl = 1 = 2 1. After entering the RUN Mode, display the sketch menu and perform the following operation. !4(SKTCH)1(Cls)w 3(Plot)c,c 1 2 3 4 2. Press w.
Graphing Chapter 4 u To draw a line between two plotted points In the STAT, GRAPH or TABLE Mode Example To draw a line between the two points of inflection on the graph of y = x(x + 2)(x – 2) Use the same View Window parameters as in the example on page 66. 1. After graphing the function, display the sketch menu and perform the following operation to cause the pointer to appear on the graph screen. !4(SKTCH)3(Plot) 2.
Graphing Chapter 4 In the RUN or PRGM Mode Example To draw a line perpendicular to the x-axis from point (x, y) = (2, 6) on the graph y = 3x Use the following View Window parameters: Xmin = –2 Ymin = –2 Xmax = 5 Ymax = 10 Xscl Yscl = 1 = 2 1. After drawing the graph, use the procedure under “To plot points” to move the pointer to (x, y) = (2, 0), then use the cursor key (f) to move the pointer on the graph y = 3x. !4(SKTCH)3(Plot) c,awwf~f 2.
Graphing Chapter 4 2. Use the d and e cursor keys to move the line left and right, and press w to draw the line at the current location. e ~ ew • To draw a horizontal line, simply press 2 (Hztl) in place of 1 (Vert), and use the f and c cursor keys to move the horizontal line on the display. In the RUN or PRGM Mode The following is the syntax for drawing vertical and horizontal lines in these modes.