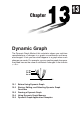
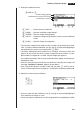
3 Chapter Dynamic Graph The Dynamic Graph Mode of this calculator shows you real-time representations of changes in a graph as coefficients and terms are changed. It lets you see what happens to a graph when such changes are made. For example, you can see the graph change as illustrated here as the value of coefficient A changes in the formula y = A x 2.
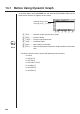
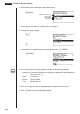
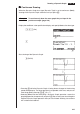
13-1 Before Using Dynamic Graph In the Main Menu, select the DYNA icon and enter the DYNA Mode. When you do the dynamic function list appears on the screen. Selected memory area Press c and f to move. 1 2 3 4 5 6 1 (SEL) ........ Dynamic Graph draw/non-draw status 2 (DEL) ........ Function delete 3 (TYPE) ..... Function type specification 4 (VAR) ........ Coefficient menu P.210 5 (B•IN) ........ Menu of built-in functions* P.218 6 (RCL) ........
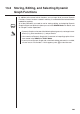
13-2 Storing, Editing, and Selecting Dynamic Graph Functions In addition to the seven built-in functions, you can input 20 of your own Dynamic Functions. Once a function is stored in memory, it can be edited and selected when needed for graphing. P.132 All of the procedures you need to use for storing, editing, and selecting Dynamic Graph functions are identical to those you use in the GRAPH Mode. For details, see “8-3 Graph Function Operations”.
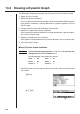
13-3 Drawing a Dynamic Graph The following is the general procedure you should use to draw a Dynamic Graph. 1. Select or input a function. 2. Define the dynamic coefficient. • This is a coefficient whose value changes in order to produce the different graphs. • If the dynamic coefficient is already defined from a previous operation, you can skip this step. 3. Assign values to each of the coefficients of the function. 4. Specify the range of the dynamic coefficient.
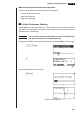
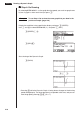
Drawing a Dynamic Graph 13 - 3 2. Display the coefficient menu. 4(VAR) or w Function being graphed Coefficient whose value will change Coefficients in function 1 2 3 4 5 6 1 (SEL) ........ Selects dynamic coefficient 2 (RANG) .... Dynamic coefficient range settings 3 (SPEED) ... Dynamic Graph drawing speed 5 (AUTO) ..... Automatic setting of end and pitch values to match coefficient values 6 (DYNA) .....
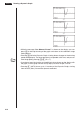
13 - 3 Drawing a Dynamic Graph 4. Recall the dynamic coefficient range setting menu. 2(RANG) Dynamic coefficient Start value End value Increment • The range you set remains in effect until you change it. 5. Change the range settings. cw J • If you want to change the Dynamic Graph speed, press 3 (SPEED). 3(SPEED) 1 2 3 4 5 6 You can set the Dynamic Graph speed to any one of the following settings. P.216 Stop & Go: Each step of the Dynamic Graph draw operation is performed each time you press w.
Drawing a Dynamic Graph 13 - 3 uTo start the Dynamic Graph draw operation There are three different variations for Dynamic Graphing. • 10-time continuous drawing • Continuous drawing • Stop and go drawing k 10-time Continuous Drawing Select Stop as the draw type (Dynamic Type) to perform 10-time continuous drawing. With this drawing style, 10 versions of the graph are drawn and then the draw operation stops automatically.
13 - 3 Drawing a Dynamic Graph ↓↑ ↓↑ • While the message “One Moment Please!” is shown on the display, you can press A to interrupt drawing of the graph and return to the coefficient range setting display. • Pressing A while the Dynamic Graph is being drawn changes to the drawing speed setting display. The draw operation is suspended at this time, and you can view the graph by pressing !6 (G ↔ T). P.
Drawing a Dynamic Graph 13 - 3 k Continuous Drawing When the Dynamic Graph draw type (Dynamic Type) is set to continuous (Cont), drawing of the Dynamic Graph continues until you press A. Example To continuously draw the same graph that you input in the previous example (page 210) Display the coefficient value specification display, and specify Cont as the draw type. !Z1(Cnt) 1 2 3 4 5 6 J 1 2 3 4 5 6 Start drawing of the Dynamic Graph.
13 - 3 Drawing a Dynamic Graph k Stop & Go Drawing By selecting STOP & GO tg as the graph drawing speed, you can draw graphs one by one. A graph is drawn each time you press w. Example To use Stop & Go to draw the same graph that you drew in the previous example (page 210) Display the coefficient value specification display and press 3 (SPEED). Use f and c to select STOP & GO (tg) and press 1 (SEL). 3(SPEED)ff 1(SEL)J 1 2 3 4 5 6 Start drawing of the Dynamic Graph.
Drawing a Dynamic Graph 13 - 3 uTo adjust the Dynamic Graph speed You can use the following procedure to adjust the Dynamic Graph speed while the draw operation is taking place. 1. While a Dynamic Graph draw operation is being performed, press A to change to the speed adjustment menu. A 1 2 3 4 5 6 1 (tg) ........... Stop & Go 2 (>) ............. Slow (1/2 Normal) 3 (g) ............ Normal (default speed) 4 (h) ............ Fast (double Normal) P.218 5 (STO) .......
13 - 3 Drawing a Dynamic Graph 13-4 Using Dynamic Graph Memory You can store Dynamic Graph conditions and screen data in Dynamic Graph memory for later recall when you need it. This lets you save time, because you can recall the data and immediately begin a Dynamic Graph draw operation. Note that you can store one set of data in memory at any one time. The following is all of the data that makes up a set.
Using Dynamic Graph Memory 13 - 4 uTo delete Dynamic Graph screen data A6(DEL) 1 2 3 4 5 6 Press 1 (YES) to delete the Dynamic Graph Screen data, or 6 (NO) to abort the operation without deleting anything.
13 - 4 Using Dynamic Graph Memory 13-5 Dynamic Graph Application Examples Example To use Dynamic Graph to graph the parabolas produced by balls thrown in the air at an initial velocity of 20m/second, at angles of 30, 45, and 60 degrees. (Angle: Deg) Use the following View Window parameters. Xmin = –1 Ymin = –1 Xmax = 42 Ymax = 16 Xscale = 5 Yscale = 2 With the initial velocity defined as V and the angle defined as θ, the parabolas can be obtained using the following expressions.
Dynamic Graph Application Examples 13 - 5 4. Start the Dynamic Graph draw operation.
13 - 5 222 Dynamic Graph Application Examples