Chapter 15 Table & Graph With Table & Graph, you can generate tables of discreet data from functions and recursion formulas, and then use the values for graphing. Because of this, Table & Graph makes it easy to grasp the nature of numeric tables and recursion formulas.
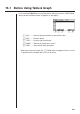
15-1 Before Using Table & Graph First select the TABLE icon on the Main Menu and then enter the TABLE Mode. When you do, the table function list appears on the display. 1 2 3 4 5 6 1 (SEL) ........ Numeric table generation/non-generation status 2 (DEL) ....... Function delete 3 (TYPE) ..... Function type specification 5 (RANG) .... Table range specification screen 6 (TABL) ......
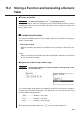
15-2 Storing a Function and Generating a Numeric Table uTo store a function Example To store the function y = 3x2 – 2 in memory area Y1 Use f and c to move the highlighting in the TABLE Mode function list to the memory area where you want to store the function. Next, input the function and press w to store it. k Variable Specifications There are two methods you can use to specify value for the variable x when generating a numeric table.
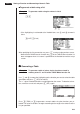
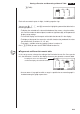
15 - 2 Storing a Function and Generating a Numeric Table u To generate a table using a list Example To generate a table using the values in List 6 !Z 1 2 3 4 5 6 • If the highlighting is not located at the Variable item, use f and c to move it there. 2(LIST)6(List6) After specifying the list you want to use, press J to return to the previous screen.
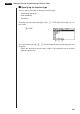
Storing a Function and Generating a Numeric Table 15 - 2 6(TABL) Each cell can contain up to six digits, including negative sign. You can use d, e, f, and c to move the highlighting around the table for the following purposes. • To display the selected cell’s value at the bottom of the screen, using the calculator’s current number of decimal place, number of significant digit, and exponential display range settings. • To scroll the display and view parts of the table that do not fit in the display.
15 - 2 Storing a Function and Generating a Numeric Table k Specifying the function type You can specify a function as being one of three types. • Rectangular coordinate • Polar coordinate • Parametric To display the menu of function types, press 3 (TYPE) while the function list is on the screen. 3(TYPE) 1 2 3 4 5 6 Press the function key (1, 2, 3) that corresponds to the function type you want to specify.
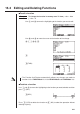
15-3 Editing and Deleting Functions u To edit a function Example To change the function in memory area Y1 from y = 3x2 – 2 to y = 3x2 – 5 Use f and c to move the highlighting to the function you want to edit. Use d and e to move the cursor to the location of the change. eeeeef w 6(TABL) • The Function Link Feature automatically reflects any changes you make to functions in the TABLE Mode list in the GRAPH Mode and DYNA Mode lists.
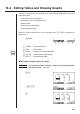
15-4 Editing Tables and Drawing Graphs You can use the table menu to perform any of the following operations once you generate a table. • Change the values of variable x • Edit (delete, insert, and append) rows • Delete a table • Draw a connect type graph • Draw a plot type graph While the Table & Graph menu is on the display, press 6 (TABL) to display the table menu. 6(TABL) 1 2 3 4 5 6 1 (FORM) .... Display function list 2 (DEL) ....... Delete table 3 (ROW) ...... Display menu of row operations P.
Editing Tables and Drawing Graphs 15 - 4 • When you change a variable value in Column x, all values in the columns to the right are recalculated and displayed. • If you try to replace a value with an illegal operation (such as division by zero), an Ma ERROR occurs and the original value remains unchanged. • You cannot directly change any values in the other (non-x) columns of the table. k Row Operations The following menu appears whenever you press 3 (ROW) while the table menu is on the display.
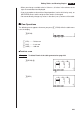
15 - 4 Editing Tables and Drawing Graphs u To insert a row Example To insert a new row between Rows 1 and 2 in the table generated on page 239 3(ROW)c 1 2 3 4 5 6 2(INS) u To add a row Example To add a new row below Row 7 in the table generated on page 239 3(ROW) cccccc 1 2 3 4 5 6 3(ADD) k Deleting a Table 1. Display the table you want to delete and then press 2 (DEL). 2(DEL) 1 2 3 4 5 6 2. Press 1 (YES) to delete the table or 6 (NO) to abort the operation without deleting anything.
Editing Tables and Drawing Graphs 15 - 4 k Graphing a Function u To specify the draw/non-draw status of a formula There are two options for the draw/non-draw status of a function graph. • For the selected function only • Overlay the graphs for all functions P.238 To specify the draw/non-draw status, use same procedure as that for specifying table generation/non-generation status.
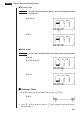
15 - 4 Editing Tables and Drawing Graphs u To graph all of the functions Example To use the values in the numeric table generated using the Table Range and the View Window parameters from the previous example to graph all functions stored in memory as plot type graphs. 1 2 3 4 5 6 6(TABL) 1 2 3 4 5 6 6(G•PLT) (Specifies plot type graph.) • After you graph a function, you can press !6 (G↔T) or A to return to the function’s numeric table. P.
Editing Tables and Drawing Graphs 15 - 4 u To graph a function using Dual Screen P.8 Selecting “T+G” for the Dual Screen item of the set up screen makes it possible to display both the graph and its numeric table of values. Example To graph y = 3 x2 – 2 in memory are Y1, displaying both the graph and its table Use the same View Window parameters as in the example on page 245. !Z cc1(T+G) (Specifies T+G for Dual Screen.) 1 2 3 4 5 6 J 1 2 3 4 5 6 6(TABL) (Shows the table.
15-5 Copying a Table Column to a List A simple operation lets you copy the contents of a numeric table column into a list. u To copy a table to a list Example To copy the contents of Column x into List 1 K1(LIST)2(LMEM) • You can select any row of the column you want to copy. Press the function key (1 to 6) that corresponds the list you want to copy to.