Chapter 16 Recursion Table and Graph You can input two formulas for any of the three following types of recursion, which you can then use to generate a table and draw graphs.
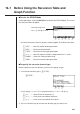
16-1 Before Using the Recursion Table and Graph Function u To enter the RECUR Mode On the Main Menu, select the RECUR icon and enter the RECUR Mode. This causes the Recursion Menu to appear. Selected storage area Press f and c to move. 1 2 3 4 5 6 • All recursion formulas that are stored in memory appear in the Recursion Menu. 1 (SEL) ........ Menu for control of table generation 2 (DEL) ....... Recursion formula delete 3 (TYPE) ..... Recursion formula type specification 4 (n, an ...) ....
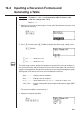
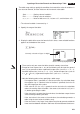
16-2 Inputting a Recursion Formula and Generating a Table Example 1 To input an+1 = 2an + 1 and generate a table of values as the value of n change from 1 to 6 Make a1 = 1. 1. Specify the recursion formula type as linear recursion between two terms and then input the formula. c4(n, an...) 2( an)+b 1 2 3 4 5 6 2. Press w and then press 5 (RANG) to display the table range setting screen. w5(RANG) 1 2 3 4 5 6 1 (a0) ........... Value for a0 (b0) 2 (a1) ........... Value for a1 (b1) P.
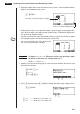
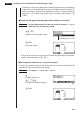
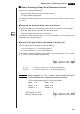
16 - 2 Inputting a Recursion Formula and Generating a Table 4. Display the table of the recursion formula. At this time, a menu of table functions appears at the bottom of the screen. J6(TABL) Currently selected cell (up to six digits) Value in currently highlighted cell • Displayed cell values show positive integers up to six digits, and negative integers up to five digits (one digit used for negative sign). Exponential display can use up to three significant digits.
Inputting a Recursion Formula and Generating a Table 16 - 2 The table range settings specify the conditions that control the value of variable n in the recursion formula, and the initial term of the numeric value table. Start ................ Starting value of variable n End ................. Ending value of variable n a0, a1, a2 .......... Values of 0th term a0/ b0, 1st term a1/b1 , and 2nd term a2/ b2. • The value of variable n increments by 1. 3. Specify the range of the table. 2( a1) bwgwbwbw 4.
16 - 2 Inputting a Recursion Formula and Generating a Table • Changing the angle unit setting while a table generated from a trigonometric expression is on the display does not cause the displayed values to change. To cause the values in the table to be updated using the new setting, display the table, press 1 (FORM), change the angle unit setting, and then press 6 (TABL).
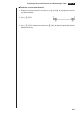
Inputting a Recursion Formula and Generating a Table 16 - 2 u To delete a recursion formula 1. Display the Recursion Menu and then use f and c to highlight the formula you want to delete. 2. Press 2 (DEL). 1 2 3 4 5 6 3. Press 1 (YES) to delete the formula or 6 (NO) to abort the operation without deleting anything.
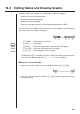
16-3 Editing Tables and Drawing Graphs You get a choice of four options for editing tables and drawing graphs. • Deletion of a recursion formula table • Drawing of a connect type graph • Drawing of a plot type graph • Drawing of a graph and analysis of convergence/dievergence (WEB) You can access these options from the function menu that appears at the bottom of the screen whenever a table is displayed. 1 2 3 4 5 6 1 (FORM) .... Returns to Recursion Menu. 2 (DEL) ....... Table delete P.259 4 (WEB) ......
Editing Tables and Drawing Graphs 16 - 3 k Before Drawing a Graph for a Recursion Formula You must first specify the following. • Draw/non-draw status of for the recursion formula • The type of data to be plotted To specify the draw/non-draw status, display the Recursion Menu and then press 1 (SEL). u To specify the draw/non-draw status of a formula There are two options for the draw/non-draw status of a recursion formula graph.
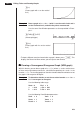
16 - 3 Editing Tables and Drawing Graphs 1( an) (Draws graph with an on the vertical axis.) Example 2 Draw a graph of an+1 = 2an + 1 with Σ an on the vertical axis and n on the horizontal axis, and with the points unconnected. Use the same View Window parameters as those provided in Example 1. 6(TABL)6(G•PLT) (Selects plot type.) 1 2 3 4 5 6 6(Σan) (Draws graph with Σ an on the vertical axis.) • To input a different recursion formula after a graph is drawn, press ! Q.
Editing Tables and Drawing Graphs 16 - 3 This example assumes that the following two recursion formulas are already stored in memory. 1 2 3 4 5 6 1. Press 6 (TABL) to generate a table. 6(TABL) 2. Press 4 (WEB) to draw the graph. 4(WEB) 3. Press w, and the pointer appears at the pointer start point ( anStr = 0.01). w • The Y value for the pointer start point is always 0. 4. Each press of w draws web-like lines on the display.
16 - 3 Editing Tables and Drawing Graphs This graph indicates that recursion formula an+1 = –3an2 + 3an is convergent. Example 2 To determine whether or not the recursion formula b n+1 = 3bn + 0.2 is convergent or divergent. Use the following table range. Start = 0 End b0 bn Str = 0.02 = 0.02 = 6 Use the View Window parameters from Example 1. 1 2 3 4 5 6 1. Press 6 (TABL) 4 (WEB) to draw the graph. 6(TABL) 4(WEB) 2.
Editing Tables and Drawing Graphs 16 - 3 3. Each press of w draws web-like lines on the display. w ↓ w ↓ This graph indicates that recursion formula bn+1 = 3bn + 0.2 is divergent. • Inputting bn or n for the expression an+1, or Inputting an or n for the expression bn+1 for linear recursion between two terms causes an error. u To draw a recursion formula graph using Dual Screen P.8 P.