Chapter Sketch Function The sketch function lets you draw lines and graphs on an existing graph. • Note that Sketch function operation in the STAT, GRAPH, TABLE, RECUR and CONICS Modes is different from Sketch function operation in the RUN and PRGM Modes.
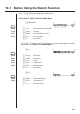
10-1 Before Using the Sketch Function Press ! 4 (Sketch) to display the sketch menu. STAT, GRAPH, TABLE, RECUR, CONICS Mode !4(Sketch) 1 2 3 4 5 6 P.188 1 (Cls) ......... Clears drawn line and point P.176 2 (Tang) ....... Tangent P.177 3 (Norm) ...... Line normal to a curve P.178 4 (Inv) .......... Inverse graph 6 (g) ........... Next menu • 2 (Tang), 3 (Norm), and 4 (Inv) appear only when you display the sketch menu while in the GRAPH and TABLE Modes. 6 (g) 1 2 3 4 5 6 P.179 1 (PLOT) .....
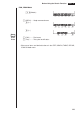
Before Using the Sketch Function 10 - 1 RUN, PRGM Mode !4(Sketch) 1 2 3 4 5 6 5 (GRPH) .... Graph command menu 6 (g) 1 2 3 4 5 6 6 (g) 1 2 3 4 5 6 P.187 3 (PIXL) ....... Pixel menu P.188 4 (Test) ........ Tests pixel on/off status • Other menu items are identical to those in the STAT, GRAPH, TABLE, RECUR, CONICS Mode menu.
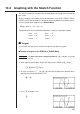
10-2 Graphing with the Sketch Function The sketch function lets you draw lines and plot points on a graph that is already on the screen. All the examples in this section that show operations in the STAT, GRAPH, TABLE, RECUR, and CONICS Modes are based on the assumption that the following function has already been graphed in the GRAPH Mode. Memory Area Y1 = x( x + 2)(x – 2) The following are the View Window parameters used when drawing the graph.
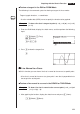
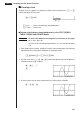
Graphing with the Sketch Function 10 - 2 u To draw a tangent in the RUN or PRGM Mode The following is the command syntax for drawing a tangent in these modes. Tangent , < x-coordinate> P.33 • Use the variable data (VARS) menu to specify the function to be graphed. Example To draw a line that is tangent to point (x = 2, y = 0) of y = x( x + 2) (x – 2) 1. Enter the RUN Mode, display the sketch menu, and then perform the following input. !4(Sketch)2(Tang) J4(GRPH) 1(Y)b,c 1 2 3 4 5 6 2.
10 - 2 Graphing with the Sketch Function 2. Use the cursor keys (f, c, d, e) to move the pointer the position of the point where you want to draw the line. e~e 3. Press w to draw the line. w u To draw a line normal to a curve in the RUN or PRGM Mode The following is the syntax for drawing a line normal to a curve in these modes. Normal , < x-coordinate> P.33 • Use the variable data (VARS) menu to specify the function to be graphed.
Graphing with the Sketch Function 10 - 2 u To graph an inverse function in the RUN or PRGM Mode The following is the syntax for graphing an inverse function in these modes. Inverse P.33 • Use the variable data (VARS) menu to specify the function to be graphed. • You can only graph the inverse of functions whose graph type is specified as rectangular coordinate type.
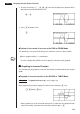
10 - 2 Graphing with the Sketch Function u To plot points in the RUN or PRGM Mode The following is the syntax for plotting points in these modes. Plot < x-coordinate>, Example To plot a point at (2, 2) Use the following View Window parameters. Xmin = –5 Ymin = –10 Xmax = 5 Ymax = 10 Xscale = 1 Yscale = 2 1. After entering the RUN Mode, display the sketch menu and perform the following operation. !4(Sketch)6(g) 1(PLOT)1(Plot)c,c 1 2 3 4 5 6 2.
Graphing with the Sketch Function 10 - 2 k Turning Plot Points On and Off Use the following procedures to turn specific plot points on and off. u To turn plot points on and off in the STAT, GRAPH, TABLE, RECUR and CONICS Modes • To turn a plot point on 1. After drawing a graph, display the sketch menu and then perform the following operation to make the pointer appear at the center of the screen. !4(Sketch)6(g)1(PLOT)2(Pl•On) 2.
- 2 Graphing with the Sketch Function k Drawing a Line To draw a line on a graph, first display the sketch menu and then press 6 (g) 2 (LINE) to display the line menu. 6(g)2(LINE) 1 2 3 4 5 6 1 (Line) ........ Draw a line between two plotted points 2 (F•Line) ....
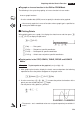
Graphing with the Sketch Function 10 - 2 4. Display the sketch menu and perform the following operation to draw a line between the two points. !4(Sketch)6(g) 2(LINE)1(Line) uTo draw a line in the STAT, GRAPH, TABLE, RECUR and CONICS Modes Example To draw a line between two points of inflection on the graph of y = x(x + 2)(x – 2) 1. After graphing the function, display the sketch menu and perform the following operation to cause the pointer to appear on the graph screen.
10 - 2 Graphing with the Sketch Function k Drawing a Circle You can use the following procedures to draw a circle on a graph. u To draw a circle in the STAT, GRAPH, TABLE, RECUR and CONICS Modes Example To draw a circle with a radius of R = 1 centered at point (1, 0) on the graph of y = x(x + 2)(x – 2) 1. After graphing the function, display the sketch menu and perform the following operation to cause the pointer to appear on the graph screen. !4(Sketch)6(g)3(Crcl) 2.
Graphing with the Sketch Function 10 - 2 k Drawing Vertical and Horizontal Lines The procedures presented here draw vertical and horizontal lines that pass through a specific coordinate. u To draw vertical and horizontal lines in the STAT, GRAPH, TABLE, RECUR and CONICS Modes Example To draw a vertical line on the graph of y = x(x + 2)(x – 2) 1.
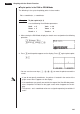
10 - 2 Graphing with the Sketch Function Example To draw on the graph of y = x(x + 2)(x – 2) 1. After graphing the function, display the sketch menu and perform the following operation to cause the pointer to appear on the graph screen. !4(Sketch)6(g)6(g)1(PEN) 2. Use the cursor keys (f, c, d, e) to move the pointer to the location where you want to start drawing and press w to plot it. 3. Use the cursor keys to move the pointer, drawing a line as it moves.
Graphing with the Sketch Function 10 - 2 e ~ ef ~ f aY!=v (v+c)(v-c) u To insert text in the RUN or PRGM Mode The following is the syntax for inserting text in these modes. Text , , “” • The line number can be specified within the range of 1 to 63, while the column number can be specified in the range of 1 to 127. • The following are the characters that can be used inside of comment text in the STAT, GRAPH, TABLE, RECUR, or CONICS Mode. A~Z, r, θ, space, 0~9, .
10 - 2 Graphing with the Sketch Function u To turn pixels on and off • To turn a pixel on PxlOn , • To turn a pixel off PxlOff , • To change the on/off status of a pixel PxlChg , u To check the on/off status of a pixel While the sketch menu is on the screen, press 6 (g) 6 (g) 4 (Test) and then input the command shown below to check the status of the specified pixel.