Chapter Graphing A collection of versatile graphing tools plus a large 127 × 63-dot display makes it easy to draw a variety of function graphs quickly and easily. This calculator is capable of drawing the following types of graphs. • Rectangular coordinate (Y =) graphs • Polar coordinate (r =) graphs • Parametric graphs • X = constant graphs • Inequality graphs • Integration graphs (in the RUN mode only) A selection of graph commands also makes it possible to incorporate graphing into programs.
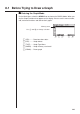
8-1 Before Trying to Draw a Graph k Entering the Graph Mode On the Main Menu, select the GRAPH icon and enter the GRAPH Mode. When you do, the Graph Function menu appears on the display. You can use this menu to store, edit, and recall functions and to draw their graphs. Memory area Use f and c to change selection. 1 2 3 4 5 6 1 (SEL) ........ Draw/non-draw status 2 (DEL) ....... Graph delete 3 (TYPE) ..... Graph Type Menu 5 (GMEM) ... Graph memory save/recall 6 (DRAW)....
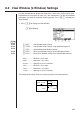
8-2 View Window (V-Window) Settings Use the View Window to specify the range of the x-and y-axes, and to set the spacing between the increments on each axis. You should always set the View Window parameters you want to use before drawing a graph. Press ! 3 to display the View Window. 1. Press !3 to display the View Window. !3(V-Window) 1 2 3 4 5 6 P.129 1 (INIT) ........ View Window initial settings P.129 2 (TRIG) ...... View Window initial settings using specified angle unit P.130 3 (STD) .......
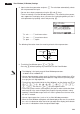
8-2 View Window (V-Window) Settings 2. Input a value for a parameter and press w. The calculator automatically selects the next parameter for input. • You can also select a parameter using the c and f keys. • There are actually nine View Window parameters. The remaining three parameters appear on the display when you move the highlighting down past the Y scale parameter by inputting values and pressing c. T, θ min .......... T, θ minimum values T, θ max ......... T, θ maximum values T, θ pitch ........
View Window (V-Window) Settings 8-2 • When View Window values are changed, the graph display is cleared and the newly set axes only are displayed. • View Window setting may cause irregular scale spacing. • Setting maximum and minimum values that create too wide of a View Window range can result in a graph made up of disconnected lines (because portions of the graph run off the screen), or in graphs that are inaccurate.
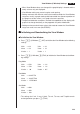
8-2 View Window (V-Window) Settings uTo standardize the View Window Press !3 (V-Window) 3 (STD) to standardize the View Window to the following settings. Xmin = –10 Ymin = –10 Xmax = 10 Ymax = 10 Xscale = 1 Yscale = 1 k View Window Memory You can store up to six sets of View Window settings in View Window memory for recall when you need them.
View Window (V-Window) Settings 8-2 1(V·W1) • Recalling View Window settings causes the settings currently on the display to be deleted. • You can change View Window settings in a program using the following syntax.
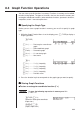
-3 Graph Function Operations You can store up to 20 functions in memory. Functions in memory can be edited, recalled, and graphed. The types of functions that can be stored in memory are: rectangular coordinate functions, polar coordinate functions, parametric functions, inequalities, and X = constant expressions. k Specifying the Graph Type Before you can store a graph function in memory, you must first specify its graph type. 1.
Graph Function Operations 8-3 w (Stores expression.) • You will not be able to store the expression in an area that already contains a parametric function. Select another area to store your expression or delete the existing parametric function first. This also applies when storing r = expressions, X = constant expressions, and ineqalities.
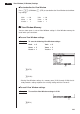
8-3 Graph Function Operations u To store an X = constant expression Example To store the following expression in memory area X4 : X=3 3(TYPE)4(X = c) (Specifies X = constant expression.) d (Inputs expression.) w (Stores expression.) • Inputting X, Y, T, r, or θ for the constant in the above procedures causes an error (Syn ERROR). u To store an inequality Example To store the following inequality in memory area Y5 : y > x2 – 2x – 6 3(TYPE)6(g)1(Y>) (Specifies an inequality.
Graph Function Operations 8-3 u To delete a function 1. While the Graph Function Menu is on the display, press f or c to display the cursor and move the highlighting to the area that contains the function you want to delete. 2. Press 2 (DEL). 1 2 3 4 5 6 3. Press 1 (YES) to delete the function for 6 (NO) to abort the procedure without deleting anything. Parametric functions come in pairs (Xt and Yt). When editing a parametric function, clear the graph functions and re-input from the beginning.
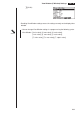
8-3 Graph Function Operations cc1(SEL) c1(SEL) 1 2 3 4 5 6 6(DRAW) or w (Draws graphs.) • Pressing ! 6 (G↔T) or A returns to the Graph Function Menu. • You can use the set up screen settings to alter the appearance of the graph screen as shown below. P.6 • Grid: On This setting causes dots to appear at the grid intersects on the display. • Axes: Off This setting clears the axis lines from the display. • Label: On This setting displays labels for the x- and y-axes.
Graph Function Operations 8-3 • A polar coordinate (r =) or parametric graph will appear coarse if the settings you make in the View Window cause the T, θ pitch value to be too large, relative to the differential between the T, θ min and T, θ max settings. If the settings you make cause the T, θ pitch value to be too small relative to the differential between the T, θ min and T, θ max settings, on the other hand, the graph will take a very long time to draw.
8-4 Graph Memory Graph memory lets you store up to six sets of graph function data and recall it later when you need it. A single save operation saves the following data stored in graph memory.
Graph Memory 8-4 u To recall graph functions from graph memory Example To recall the data in graph memory GM1 1 2 3 4 5 6 5(GMEM) 1 2 3 4 5 6 2(RCL) 1 2 3 4 5 6 1(GM1) • Recalling data from graph memory causes any data currently on the Graph Function Menu to be deleted.
8-5 Drawing Graphs Manually After you select the RUN icon in the Main Menu and enter the RUN Mode, you can draw graphs manually. First press ! 4 (Sketch) 5 (GRPH) to recall the Graph Command Menu, and then input the graph function. !4(Sketch) 5(GRPH) 1 2 3 4 5 6 1 (Y =) ......... Rectangular coordinate graph 2 (r =) .......... Polar coordinate graph 3 (Parm) ...... Parametric graph 4 (X = c) ...... X = constant graph 5 (G∫dx) ....... For drawing integration graphs 6 (g) ...........
Drawing Graphs Manually 8-5 3. Press w to draw the graph. w • You can draw graphs of the following built-in scientific functions. • sin x • cos x • tan x • sin–1 x • cos–1 x • tan–1 x • sinh x • cosh x • tanh x • sinh–1 x • cosh–1 x • tanh–1 x 2 • •x • lnx • 10x •x –1 • • log x • ex 3 View Window settings are made automatically for built-in graphs. u To graph using polar coordinates (r =) You can graph functions that can be expressed in the format r = f ( θ).
8-5 Drawing Graphs Manually 3. Input the polar coordinate expression (r =). !4(Sketch)1(Cls)w 5(GRPH)2( r =) csdv 4. Press w to draw the graph. w • You can draw graphs of the following built-in scientific functions. • sin θ • cos θ • tan θ • sin–1 θ • cos–1 θ • tan–1 θ • sinh θ • cosh θ • tanh θ • sinh–1 θ • cosh–1 θ • tanh–1 θ • θ • θ2 • log θ • lnθ • 10 •θ –1 • θ • eθ θ 3 • View Window settings are made automatically for built-in graphs.
Drawing Graphs Manually 8-5 1. In the set-up screen, specify the appropriate graph type for Func Type. !Zc3(Parm) 2. Set the default angle unit to radians (Rad). ccc2(Rad)J 3. Input the parametric functions. !4(Sketch)1(Cls)w 5(GRPH)3(Parm) hcv-ccd.fv, hsv-csd.fv) 4. Press w to draw the graph. w u To graph X = constant You can graph functions that can be expressed in the format X = constant. Example To graph X = 3 Use the following View Window parameters.
8-5 Drawing Graphs Manually 3. Press w to draw the graph. w u To graph inequalities You can graph inequalities that can be expressed in the following four formats. • y > f (x) • y < f (x) • y > f (x) • y < f (x) Example To graph the inequality y > x2 – 2x – 6 Use the following View Window parameters. Xmin = –6 Ymin = –10 Xmax = 6 Ymax = 10 Xscale = 1 Yscale = 5 1. In the set-up screen, specify the appropriate graph type for Func Type. !Zc6(g)1(Y>)J 2. Input the inequality.
Drawing Graphs Manually 8-5 u To draw an integration graph You can graph an integration calculation performed using the function y = f(x). Example To graph the following: ∫ 1 –2 (x + 2) (x – 1) ( x – 3) dx Use the following View Window parameters. Xmin = –4 Ymin = –8 Xmax = 4 Ymax = 12 Xscale = 1 Yscale = 5 1. In the set-up screen, specify the appropriate graph type for Func Type. !Zc1(Y =)J 2. Input the integration graph expression.
8-6 Other Graphing Functions The functions described in this section tell you how to read the x- and y-coordinates at a given point, and how to zoom in and zoom out on a graph. • These functions can be used with rectangular coordinate, polar coordinate, parametric, X = constant, and inequality graphs only. k Connect Type and Plot Type Graphs (Draw Type) P.6 You can use the Draw Type setting of the set-up screen to specify one of two graph types.
Other Graphing Functions 8-6 1. After drawing the graphs, press 1 (Trace) to make the pointer appear at the far left of the graph. 1(Trace) • The pointer may not be visible on the graph when you press 1 (Trace). 2. Use e to move the pointer to the first intersection. e~e x / y coordinate values • Pressing d and e moves the pointer along the graph. Holding down either key moves the pointer at high speed. 3. Use f and c to move the pointer between the two graphs. 4.
8-6 Other Graphing Functions • The following shows how the display of coordinates and the derivative changes according to the Graph Type setting. • Rectangular Coordinate Graph • Polar Coordinate Graph • Parametric Function Graph • X = Constant Graph • Inequality Graph P.141 P.6 • The derivative is not displayed when you use trace with a built-in scientific function. • Setting the Coord item in the set-up screen to “Off” turns display of the coordinates for the current pointer location off.
Other Graphing Functions 8-6 k Scroll You can scroll a graph along its x- or y-axis. Each time you press f, c, d, or e, the graph scrolls 12 dots in the corresponding direction. k Graphing in a Specific Range You can use the following syntax when inputting a graph to specify a start point and end point. , ! [ , ! ] w Example To graph y = x2 + 3x – 5 within the range of –2 < x < 4 Use the following View Window parameters.
8-6 Other Graphing Functions Example To graph y = A x2 – 3, substituting 3, 1, and –1 for the value of A Use the following View Window parameters. Xmin = –5 Ymin = –10 Xmax = 5 Ymax = 10 Xscale = 1 Yscale = 2 3(TYPE)1(Y =) (Specifies graph type.) aAvx-d, ![aA!=d, b,-b!]w 1 2 3 4 5 6 (Stores expression.) 6(DRAW) (Draws graph.) ↓ ↓ • The function input using the above syntax can have only one variable. • You cannot use X, Y, r, θ, or T as the variable name.
Other Graphing Functions 8-6 k Zoom The zoom feature lets you enlarge and reduce a graph on the display. u Before using zoom Immediately after drawing a graph, press 2 (Zoom) to display the Zoom Menu. 2(Zoom) 1 2 3 4 5 6 1 (BOX) ....... Graph enlargement using box zoom 2 (FACT) ..... Displays screen for specification of zoom factors 3 (IN) ........... Enlarges graph using zoom factors 4 (OUT) ....... Reduces graph using zoom factors P.155 5 (AUTO) ....
8-6 Other Graphing Functions 1. After graphing the function, press 2 (Zoom). 2(Zoom) 1 2 3 4 5 6 2. Press 1 (BOX), and then use the cursor keys (d, e, f, c) to move the pointer to the location of one of the corners of the box you want to draw on the screen. Press w to specify the location of the corner. 1(BOX) d ~ dw 3. Use the cursor keys to move the pointer to the location of the corner that is diagonally across from the first corner. f~fd~d 4. Press w to specify the location of the second corner.
Other Graphing Functions 8-6 u To use factor zoom With factor zoom, you can zoom in or zoom out on the display, with the current pointer location being at the center of the new display. • Use the cursor keys (d, e, f, c) to move the pointer around the display. Example Graph the two functions below, and enlarge them five times in order to determine whether or not they are tangential. Y1 = (x + 4) (x + 1) ( x – 3) Y2 = 3x + 22 Use the following View Window parameters.
8-6 Other Graphing Functions 4. Press J to return to the graphs, and then press 3 (IN) to enlarge them. J 3(IN) This enlarged screen makes it clear that the graphs of the two expressions are not tangential. Note that the above procedure can also be used to reduce the size of a graph (zoom out). In step 4, press 4 (OUT). • The above procedure automatically converts the x-range and y-range View Window values to 1/5 of their original settings.
Other Graphing Functions 8-6 2. Press 5 (AUTO). 5(AUTO) • You can use auto View Window with any type of graph. • You cannot use auto View Window inside a program. • You can use auto View Window with a graph produced by a multi-statement connected by “:”, even if the multi-statement includes non-graph operations.
8-6 Other Graphing Functions • You can use SQR with any type of graph. • You cannot use SQR inside a program. • You can use SQR with a graph produced by a multi-statement connected by “:”, even if the multi-statement includes non-graph operations.
Other Graphing Functions 8-6 • You can use RND with any type of graph. • You cannot use RND inside a program. • You can use RND with a graph produced by a multi-statement connected by “:”, even if the multi-statement includes non-graph operations.
8-6 Other Graphing Functions • You can use INTG with any type of graph. • You cannot use INTG inside a program. • You can use INTG with a graph produced by a multi-statement connected by “:”, even if the multi-statement includes non-graph operations.
8-7 Picture Memory You can save up to six graphic image in picture memory for later recall. You can overdraw the graph on the screen with another graph stored in picture memory. u To store a graph in picture memory The following operation stores all points and lines currently on the screen.
8-7 Picture Memory • Dual Graph screens or any other type of graph that uses a split screen cannot be saved in picture memory.
8-8 Graph Background P.7 You can use the set-up screen to specify the memory contents of any picture memory area (Pict 1 through Pict 6) as the Background item. When you do, the contents of the corresponding memory area is used as the background of the graph screen. • You can use a background in the RUN, STAT, GRAPH, DYNA, TABLE, RECUR, CONICS Modes.
8-8 Graph Background Example 2 With a statistical histogram as the background, graph a normal distribution Recall the backgound graph. (Histogram) Graph the normal distribution. P.283 • See “18. Statistical Graphs and Calculations” for details on drawing a statistical graphs.