
Calculator User's Guide


6-6
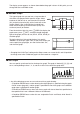
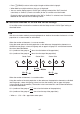
I Normal Distribution Curve
The normal distribution curve is graphed using the normal
distribution function.
XList specifies the list where the data is input, while Freq
specifies the list where the data frequency is input. 1 is
specified for Freq when frequency is not specified.
I Broken Line Graph
Lines connect center points of a histogram bar.
XList specifies the list where the data is input, while Freq specifies the list where the data
frequency is input. 1 is specified for Freq when frequency is not specified.
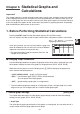
U(DRAW)
The display screen appears as shown above before the graph is drawn. At this point, you can
change the Start and Width values.
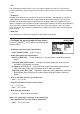
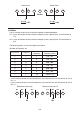
I Displaying the Calculation Results of a Drawn Single-Variable Graph
Single-variable statistics can be expressed as both graphs
and parameter values. When these graphs are displayed,
the single-variable calculation results appear as shown to
the right when you press (1VAR).
• Use A to scroll the list so you can view the items that run off the bottom of the screen.
The following describes the meaning of each of the parameters.
Q1 ................first quartile
Med..............median
Q3 ................third quartile
maxX............maximum
Mod..............mode
Mod:
n ..........number of data mode items
Mod:F ..........data mode frequency
¯x ..................mean
3
x ................sum
3
x
2
...............sum of squares
S
x
.................population standard
deviation
s
x
.................sample standard
deviation
n ..................number of data items
minX.............minimum