
Calculator User's Guide


8-28
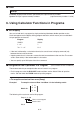
• Executing DrawDistF performs the above calculation in accordance with the specified
conditions and draws the graph. At this time the Lower
x Upper region on the graph is
filled in.
• At the same time, calculation result
p is assigned to variables p and Ans.
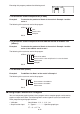
I Performing Statistical Calculations in a Program
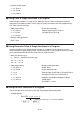
• Single-variable statistical calculation
1-Variable List1, List 2
Frequency data (Frequency)
x-axis data (XList)
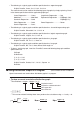
• Paired-variable statistical calculation
2-Variable List 1, List 2, List 3
Frequency data (Frequency)
y-axis data (YList)
x-axis data (XList)
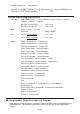
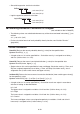
• Regression statistical calculation
LinearReg(ax+b) List 1, List 2, List 3
Frequency data (Frequency)
y-axis data (YList)
x-axis data (XList)
* Any one of the following can be specified as the calculation type.
LinearReg(a
x+b)......linear regression (ax+b type)
LinearReg(a+b
x)......linear regression (a+bx type)
Med-MedLine ..........Med-Med calculation
QuadReg .................quadratic regression
CubicReg.................cubic regression
QuartReg.................quartic regression
LogReg ...................logarithmic regression
ExpReg(a·eˆb
x)........exponential regression (a·e
bx
type)
ExpReg(a·bˆ
x)..........exponential regression (a·b
x
type)
PowerReg ...............power regression
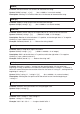
ndf
2
ndf
2
p =
–
2
ndf + ddf
2
ndf
2
ddf
ddf
ndf
ndf + ddf
2
ddf
ndf x
dxx
–1
1+
Upper
Lower
ndf
2
ndf
2
p =
–
2
ndf + ddf
2
ndf
2
ddf
ddf
ndf
ndf + ddf
2
ddf
ndf x
dxx
–1
1+
Upper
Lower
Calculation
type*
Calculation
type*