
Calculator User Manual

CASIO
7-2
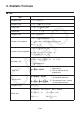
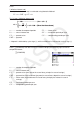
k Setup Items
indicates default setting.
u Payment
• { BEGIN }/{ END } … Specifies {beginning of the period}/{end of the period} payment
u Date Mode
• {365}/{360} … Specifies calculation according to a {365-day}/{360-day} year
u Periods/YR. (payment interval specification)
• {Annual}/{Semi} … {annual}/{semiannual}
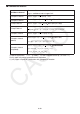
u Graph Color
• {Black}/{Blue}/{Red}/{Magenta}/{Green}/{Cyan}/{Yellow} … Specifies a single border line
color.
Note the following points regarding Setup screen settings whenever using the Financial
mode.
• The following graph Setup screen settings are all turned off for graphing in the Financial
mode: Axes, Grid, Dual Screen.
• Drawing a financial graph while the Label item is turned on, displays the label CASH for the
vertical axis (deposits, withdrawals), and TIME for the horizontal axis (frequency).
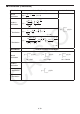
• You can use the Setup “Background” setting to display a Financial mode graph screen
background image. This operation is the same as that for the Graph mode. For details, see
“Displaying a Graph Background Image” (page 5-10). Note, however, that you cannot perform
V-Window related operations while in the Financial mode.
• While a background image is being displayed on the Financial mode graph screen, you can
adjust the lightness of the background image. For information about this operation, see “To
adjust the lightness (Fade I/O) of the background image” (page 5-12).
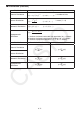
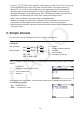
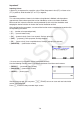
k Graphing in the Financial Mode
After performing a financial calculation, you can use 6(GRAPH) to graph the results as
shown below.