
Calculator User Manual

CASIO
9-31
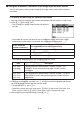
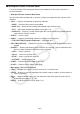
k Statistics Mode and Spreadsheet
Mode Function Menu
Correspondence Table
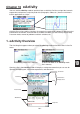
In both the Statistics mode and the Spreadsheet
mode, statistical graph functions are on
the GRAPH function menu and statistical/regression calculation functions are on the CALC
function menu. The structures of these menus and their submenus are the same in the
Statistics mode and the Spreadsheet
mode. For details about each menu item, refer to the
pages referenced in the table below.
For information about
this menu item:
Refer to:
{GRAPH} - {GRAPH1} “Statistical Graph Parameters” (page 6-1)
{GRAPH} - {GRAPH2}
{GRAPH} - {GRAPH3}
{GRAPH} - {SELECT} “Graph Draw/Non-draw Status” (page 6-7)
{GRAPH} - {SET} “Statistical Graph Parameters” (page 6-1)
“General Graph Settings”(page 6-2)
“To display the general graph settings screen”(page 6-3)
“General Graph Settings Screen Operations” (page 9-28)
{CALC} - {1-VAR} “Single-Variable Statistical Calculations” (page 6-22)
{CALC} - {2-VAR} “Paired-Variable Statistical Calculations” (page 6-23)
{CALC} - {REG} “Regression Calculation” (page 6-23)
{CALC} - {SET} “Using the Statistical Calculation Data Range Specification
Screen” (page 9-30)