
User Manual


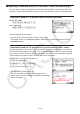


Table Of Contents
- Contents
- Getting Acquainted — Read This First!
- Chapter 1 Basic Operation
- Chapter 2 Manual Calculations
- 1. Basic Calculations
- 2. Special Functions
- 3. Specifying the Angle Unit and Display Format
- 4. Function Calculations
- 5. Numerical Calculations
- 6. Complex Number Calculations
- 7. Binary, Octal, Decimal, and Hexadecimal Calculations with Integers
- 8. Matrix Calculations
- 9. Vector Calculations
- 10. Metric Conversion Calculations
- Chapter 3 List Function
- Chapter 4 Equation Calculations
- Chapter 5 Graphing
- 1. Sample Graphs
- 2. Controlling What Appears on a Graph Screen
- 3. Drawing a Graph
- 4. Saving and Recalling Graph Screen Contents
- 5. Drawing Two Graphs on the Same Screen
- 6. Manual Graphing
- 7. Using Tables
- 8. Modifying a Graph
- 9. Dynamic Graphing
- 10. Graphing a Recursion Formula
- 11. Graphing a Conic Section
- 12. Drawing Dots, Lines, and Text on the Graph Screen (Sketch)
- 13. Function Analysis
- Chapter 6 Statistical Graphs and Calculations
- 1. Before Performing Statistical Calculations
- 2. Calculating and Graphing Single-Variable Statistical Data
- 3. Calculating and Graphing Paired-Variable Statistical Data (Curve Fitting)
- 4. Performing Statistical Calculations
- 5. Tests
- 6. Confidence Interval
- 7. Distribution
- 8. Input and Output Terms of Tests, Confidence Interval, and Distribution
- 9. Statistic Formula
- Chapter 7 Financial Calculation
- Chapter 8 Programming
- Chapter 9 Spreadsheet
- Chapter 10 eActivity
- Chapter 11 Memory Manager
- Chapter 12 System Manager
- Chapter 13 Data Communication
- Chapter 14 Geometry
- Chapter 15 Picture Plot
- Chapter 16 3D Graph Function
- Chapter 17 Python (fx-CG50, fx-CG50 AU only)
- Appendix
- Examination Mode
- E-CON4 Application
- 1. E-CON4 Mode Overview
- 2. Sampling Screen
- 3. Auto Sensor Detection (CLAB Only)
- 4. Selecting a Sensor
- 5. Configuring the Sampling Setup
- 6. Performing Auto Sensor Calibration and Zero Adjustment
- 7. Using a Custom Probe
- 8. Using Setup Memory
- 9. Starting a Sampling Operation
- 10. Using Sample Data Memory
- 11. Using the Graph Analysis Tools to Graph Data
- 12. Graph Analysis Tool Graph Screen Operations
- 13. Calling E-CON4 Functions from an eActivity
17-15
To execute a command from the SHELL screen
See “Inputting a Command Directly on the SHELL Screen and Executing It” (page 17-16).
To scroll the SHELL screen vertically (to display history lines)
Press f or c. The currently selected history line is the
one that is highlighted.
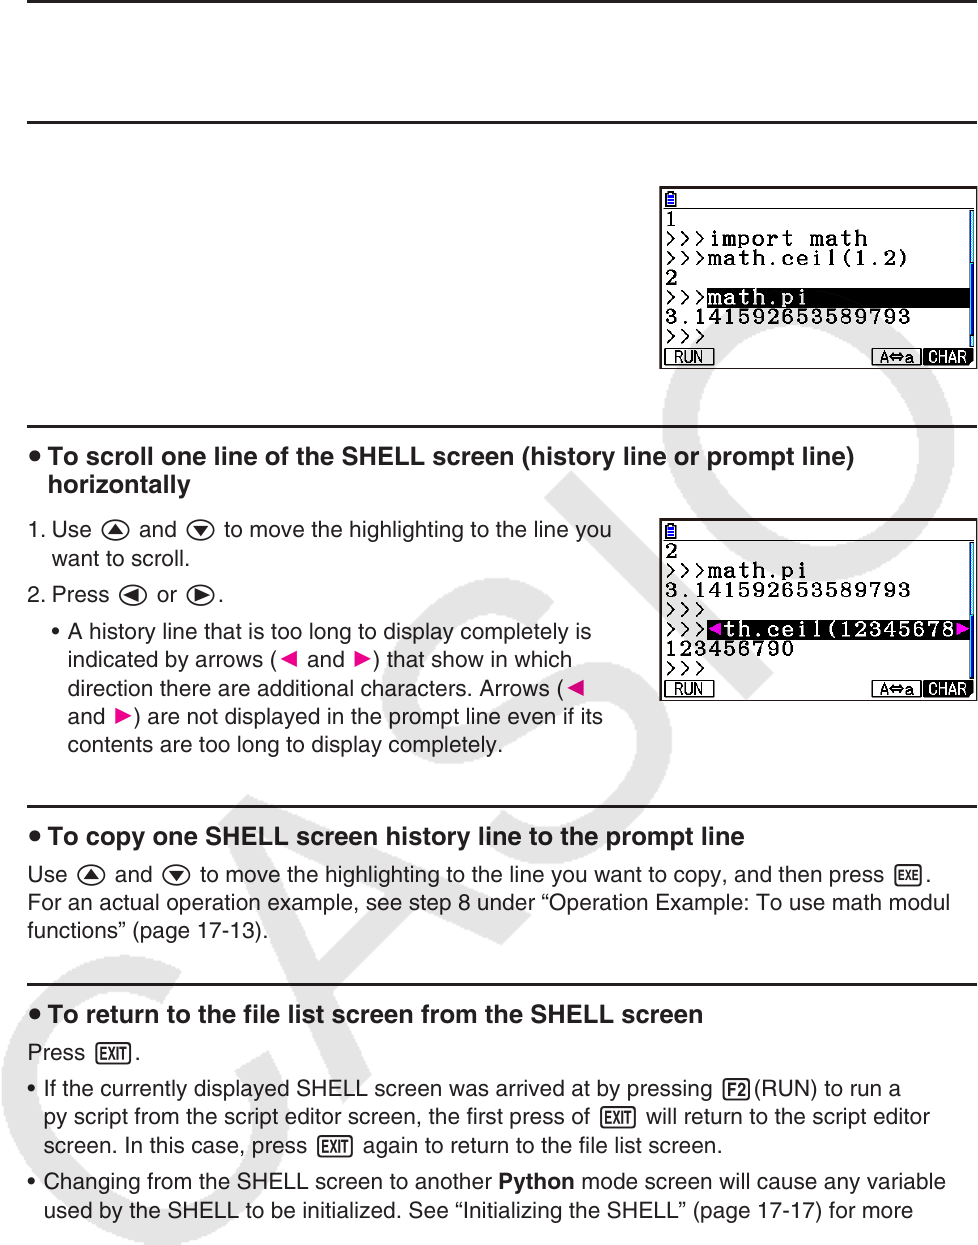
To scroll one line of the SHELL screen (history line or prompt line)
horizontally
1. Use f and c to move the highlighting to the line you
want to scroll.
2. Press d or e.
A history line that is too long to display completely is
indicated by arrows (
] and ') that show in which
direction there are additional characters. Arrows (]
and ') are not displayed in the prompt line even if its
contents are too long to display completely.
•
To copy one SHELL screen history line to the prompt line
Use f and c to move the highlighting to the line you want to copy, and then press w.
For an actual operation example, see step 8 under “Operation Example: To use math module
functions” (page 17-13).
To return to the file list screen from the SHELL screen
Press J.
If the currently displayed SHELL screen was arrived at by pressing 2(RUN) to run a
py script from the script editor screen, the first press of J will return to the script editor
screen. In this case, press J again to return to the file list screen.
Changing from the SHELL screen to another Python mode screen will cause any variables
used by the SHELL to be initialized. See “Initializing the SHELL” (page
17-17) for more
information.
u
u
u
u
u
•
•