
User Manual
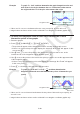

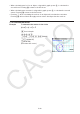

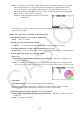

Table Of Contents
- Contents
- Getting Acquainted — Read This First!
- Chapter 1 Basic Operation
- Chapter 2 Manual Calculations
- 1. Basic Calculations
- 2. Special Functions
- 3. Specifying the Angle Unit and Display Format
- 4. Function Calculations
- 5. Numerical Calculations
- 6. Complex Number Calculations
- 7. Binary, Octal, Decimal, and Hexadecimal Calculations with Integers
- 8. Matrix Calculations
- 9. Vector Calculations
- 10. Metric Conversion Calculations
- Chapter 3 List Function
- Chapter 4 Equation Calculations
- Chapter 5 Graphing
- 1. Sample Graphs
- 2. Controlling What Appears on a Graph Screen
- 3. Drawing a Graph
- 4. Saving and Recalling Graph Screen Contents
- 5. Drawing Two Graphs on the Same Screen
- 6. Manual Graphing
- 7. Using Tables
- 8. Modifying a Graph
- 9. Dynamic Graphing
- 10. Graphing a Recursion Formula
- 11. Graphing a Conic Section
- 12. Drawing Dots, Lines, and Text on the Graph Screen (Sketch)
- 13. Function Analysis
- Chapter 6 Statistical Graphs and Calculations
- 1. Before Performing Statistical Calculations
- 2. Calculating and Graphing Single-Variable Statistical Data
- 3. Calculating and Graphing Paired-Variable Statistical Data (Curve Fitting)
- 4. Performing Statistical Calculations
- 5. Tests
- 6. Confidence Interval
- 7. Distribution
- 8. Input and Output Terms of Tests, Confidence Interval, and Distribution
- 9. Statistic Formula
- Chapter 7 Financial Calculation
- Chapter 8 Programming
- Chapter 9 Spreadsheet
- Chapter 10 eActivity
- Chapter 11 Memory Manager
- Chapter 12 System Manager
- Chapter 13 Data Communication
- Chapter 14 Geometry
- Chapter 15 Picture Plot
- Chapter 16 3D Graph Function
- Chapter 17 Python (fx-CG50, fx-CG50 AU only)
- Chapter 18 Distribution (fx-CG50, fx-CG50 AU only)
- Appendix
- Examination Modes
- E-CON4 Application (English)
- 1. E-CON4 Mode Overview
- 2. Sampling Screen
- 3. Auto Sensor Detection (CLAB Only)
- 4. Selecting a Sensor
- 5. Configuring the Sampling Setup
- 6. Performing Auto Sensor Calibration and Zero Adjustment
- 7. Using a Custom Probe
- 8. Using Setup Memory
- 9. Starting a Sampling Operation
- 10. Using Sample Data Memory
- 11. Using the Graph Analysis Tools to Graph Data
- 12. Graph Analysis Tool Graph Screen Operations
- 13. Calling E-CON4 Functions from an eActivity

6-5
• {Auto} ... Cycles the color used for graph drawing in the following sequence for each data
item (or data pair): blue, red, green, magenta, black. Cycle is repeated after all five
colors are used. For some graphs, different parts of the graph (points, lines, etc.) are
automatically drawn using different colors. {Auto} can be selected only when the graph
type is Scatter,
xyLine, NPPlot, or Broken.
Example: Scatter graph when {Auto} is specified for
Graph Color
• The Graph Color setting is always “Link” whenever anything other than “Off” is selected for
the Color Link setting.
When “Pie” (pie chart) is selected as the Graph Type:
• Data (Specifies the list to be used as graph data.)
• {LIST} ... {List 1 to List 26}
• Display (pie chart value display setting)
• {%}/{Data} ... For each data element {display as percentage}/{display as value}
• % Sto Mem (Specifies storage of percentage values to a list.)
• {None}/{List} ... For percentage values: {Do not store to list}/{Specify List 1 to 26 and store}
• Pie Area (Specifies the fill color of a pie chart.)
• Area Color
• {Black}/{Blue}/{Red}/{Magenta}/{Green}/{Cyan}/{Yellow} ... Specifies a single fill color
for each data item.
• {Auto} ... Automatically cycles the fill color in the following sequence for each data item:
blue, red, green, magenta, cyan, yellow. Cycle is repeated after all six colors are used.
• Paint Style
• {Normal}/{Lighter} ... {normal fill density}/{lighter fill density}
• The Area Color setting is always “Link” and the Paint Style setting is always “Lighter”
whenever anything other than “Off” is selected for the Color Link setting.
• Pie Border (Specifies the border line color of a pie chart.)
• {Black}/{Blue}/{Red}/{Magenta}/{Green}/{Cyan}/{Yellow} ... Specifies a single color for the
border line.
• {Clear} ... No border line drawn.