
User Manual
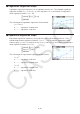
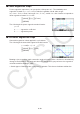

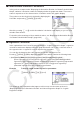

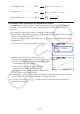
Table Of Contents
- Contents
- Getting Acquainted — Read This First!
- Chapter 1 Basic Operation
- Chapter 2 Manual Calculations
- 1. Basic Calculations
- 2. Special Functions
- 3. Specifying the Angle Unit and Display Format
- 4. Function Calculations
- 5. Numerical Calculations
- 6. Complex Number Calculations
- 7. Binary, Octal, Decimal, and Hexadecimal Calculations with Integers
- 8. Matrix Calculations
- 9. Vector Calculations
- 10. Metric Conversion Calculations
- Chapter 3 List Function
- Chapter 4 Equation Calculations
- Chapter 5 Graphing
- 1. Sample Graphs
- 2. Controlling What Appears on a Graph Screen
- 3. Drawing a Graph
- 4. Saving and Recalling Graph Screen Contents
- 5. Drawing Two Graphs on the Same Screen
- 6. Manual Graphing
- 7. Using Tables
- 8. Modifying a Graph
- 9. Dynamic Graphing
- 10. Graphing a Recursion Formula
- 11. Graphing a Conic Section
- 12. Drawing Dots, Lines, and Text on the Graph Screen (Sketch)
- 13. Function Analysis
- Chapter 6 Statistical Graphs and Calculations
- 1. Before Performing Statistical Calculations
- 2. Calculating and Graphing Single-Variable Statistical Data
- 3. Calculating and Graphing Paired-Variable Statistical Data (Curve Fitting)
- 4. Performing Statistical Calculations
- 5. Tests
- 6. Confidence Interval
- 7. Distribution
- 8. Input and Output Terms of Tests, Confidence Interval, and Distribution
- 9. Statistic Formula
- Chapter 7 Financial Calculation
- Chapter 8 Programming
- Chapter 9 Spreadsheet
- Chapter 10 eActivity
- Chapter 11 Memory Manager
- Chapter 12 System Manager
- Chapter 13 Data Communication
- Chapter 14 Geometry
- Chapter 15 Picture Plot
- Chapter 16 3D Graph Function
- Chapter 17 Python (fx-CG50, fx-CG50 AU only)
- Chapter 18 Distribution (fx-CG50, fx-CG50 AU only)
- Appendix
- Examination Modes
- E-CON4 Application (English)
- 1. E-CON4 Mode Overview
- 2. Sampling Screen
- 3. Auto Sensor Detection (CLAB Only)
- 4. Selecting a Sensor
- 5. Configuring the Sampling Setup
- 6. Performing Auto Sensor Calibration and Zero Adjustment
- 7. Using a Custom Probe
- 8. Using Setup Memory
- 9. Starting a Sampling Operation
- 10. Using Sample Data Memory
- 11. Using the Graph Analysis Tools to Graph Data
- 12. Graph Analysis Tool Graph Screen Operations
- 13. Calling E-CON4 Functions from an eActivity

6-22
k Displaying the Calculation Results of a Drawn Paired-Variable Graph
Paired-variable statistics can be expressed as both graphs and parameter values. When these
graphs are displayed, the paired-variable calculation results appear as shown below when you
press 1(CALC) 1(2-VAR).
• Use c to scroll the list so you can view the items that run off the bottom of the screen.
o ...........mean of data stored in x List
Σ
x .........sum of data stored in x List
Σ
x
2
........sum of squares of data stored in
x List
σ
x
.......... population standard deviation of
data stored in x List
s
x
..........sample standard deviation of
data stored in x List
n ........... number of data
p ............mean of data stored in
y List
Σ
y .........sum of data stored in y List
Σ y
2
........ sum of squares of data stored in y List
σ
y
.......... population standard deviation of data
stored in y List
s
y
.......... sample standard deviation of data
stored in y List
Σ
xy ........ sum of the product of data stored in
x List and y List
minX ...... minimum of data stored in
x List
maxX ..... maximum of data stored in
x List
minY ...... minimum of data stored in
y List
maxY ..... maximum of data stored in
y List
k Copying a Regression Graph Formula to the Graph Mode
You can copy regression formula calculation results to the Graph mode graph relation list, and
store and compare.
1. While a regression calculation result is on the display (see “Displaying Regression
Calculation Results” on page 6-17), press 5(COPY).
• This will display the Graph mode graph relation list.*
1
2. Use f and c to highlight the area to which you want to copy the regression formula of
the displayed result.
3. Press w to save the copied graph formula and return to the previous regression calculation
result display.
*
1
You cannot edit regression formulas for graph formulas in the Graph mode.