
User Manual
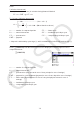
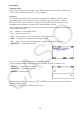
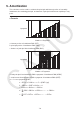
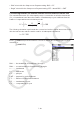
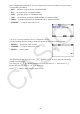
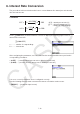
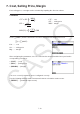
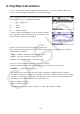
Table Of Contents
- Contents
- Getting Acquainted — Read This First!
- Chapter 1 Basic Operation
- Chapter 2 Manual Calculations
- 1. Basic Calculations
- 2. Special Functions
- 3. Specifying the Angle Unit and Display Format
- 4. Function Calculations
- 5. Numerical Calculations
- 6. Complex Number Calculations
- 7. Binary, Octal, Decimal, and Hexadecimal Calculations with Integers
- 8. Matrix Calculations
- 9. Vector Calculations
- 10. Metric Conversion Calculations
- Chapter 3 List Function
- Chapter 4 Equation Calculations
- Chapter 5 Graphing
- 1. Sample Graphs
- 2. Controlling What Appears on a Graph Screen
- 3. Drawing a Graph
- 4. Saving and Recalling Graph Screen Contents
- 5. Drawing Two Graphs on the Same Screen
- 6. Manual Graphing
- 7. Using Tables
- 8. Modifying a Graph
- 9. Dynamic Graphing
- 10. Graphing a Recursion Formula
- 11. Graphing a Conic Section
- 12. Drawing Dots, Lines, and Text on the Graph Screen (Sketch)
- 13. Function Analysis
- Chapter 6 Statistical Graphs and Calculations
- 1. Before Performing Statistical Calculations
- 2. Calculating and Graphing Single-Variable Statistical Data
- 3. Calculating and Graphing Paired-Variable Statistical Data (Curve Fitting)
- 4. Performing Statistical Calculations
- 5. Tests
- 6. Confidence Interval
- 7. Distribution
- 8. Input and Output Terms of Tests, Confidence Interval, and Distribution
- 9. Statistic Formula
- Chapter 7 Financial Calculation
- Chapter 8 Programming
- Chapter 9 Spreadsheet
- Chapter 10 eActivity
- Chapter 11 Memory Manager
- Chapter 12 System Manager
- Chapter 13 Data Communication
- Chapter 14 Geometry
- Chapter 15 Picture Plot
- Chapter 16 3D Graph Function
- Chapter 17 Python (fx-CG50, fx-CG50 AU only)
- Chapter 18 Distribution (fx-CG50, fx-CG50 AU only)
- Appendix
- Examination Modes
- E-CON4 Application (English)
- 1. E-CON4 Mode Overview
- 2. Sampling Screen
- 3. Auto Sensor Detection (CLAB Only)
- 4. Selecting a Sensor
- 5. Configuring the Sampling Setup
- 6. Performing Auto Sensor Calibration and Zero Adjustment
- 7. Using a Custom Probe
- 8. Using Setup Memory
- 9. Starting a Sampling Operation
- 10. Using Sample Data Memory
- 11. Using the Graph Analysis Tools to Graph Data
- 12. Graph Analysis Tool Graph Screen Operations
- 13. Calling E-CON4 Functions from an eActivity

7-14
8. Day/Date Calculations
You can calculate the number of days between two dates, or you can determine what date
comes a specific number of days before or after another date.
Press 2(DAYS) from the Financial 2 screen to display the
following input screen for day/date calculation.
6( g) 2(DAYS)
d1 .......... date 1
d2 .......... date 2
D .......... number of days
To input a date, first highlight d1 or d2. Pressing a number
key to input the month causes an input screen like the one
shown nearby to appear on the display.
Input the month, day, and year, pressing w after each.
After configuring the parameters, use one of the function menus noted below to perform the
corresponding calculation.
• { PRD } … {number of days from d1 to d2 (d2 – d1)}
• { d1+D } … {d1 plus a number of days (d1 + D)}
• { d1–D } … {d1 minus a number of days (d1 – D)}
• An error occurs if parameters are not configured correctly.
Use the following function menu to maneuver between calculation result screens.
• { REPEAT } … {parameter input screen}
• The Setup screen can be used to specify either a 365-day or 360-day year for financial
calculations. Day/date calculations are also performed in accordance with the current setting
for number of days in the year, but the following calculations cannot be performed when the
360-day year is set. Attempting to do so causes an error.
(Date) + (Number of Days)
(Date) – (Number of Days)
• The allowable calculation range is January 1, 1901 to December 31, 2099.