
User Manual

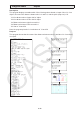

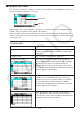
Table Of Contents
- Contents
- Getting Acquainted — Read This First!
- Chapter 1 Basic Operation
- Chapter 2 Manual Calculations
- 1. Basic Calculations
- 2. Special Functions
- 3. Specifying the Angle Unit and Display Format
- 4. Function Calculations
- 5. Numerical Calculations
- 6. Complex Number Calculations
- 7. Binary, Octal, Decimal, and Hexadecimal Calculations with Integers
- 8. Matrix Calculations
- 9. Vector Calculations
- 10. Metric Conversion Calculations
- Chapter 3 List Function
- Chapter 4 Equation Calculations
- Chapter 5 Graphing
- 1. Sample Graphs
- 2. Controlling What Appears on a Graph Screen
- 3. Drawing a Graph
- 4. Saving and Recalling Graph Screen Contents
- 5. Drawing Two Graphs on the Same Screen
- 6. Manual Graphing
- 7. Using Tables
- 8. Modifying a Graph
- 9. Dynamic Graphing
- 10. Graphing a Recursion Formula
- 11. Graphing a Conic Section
- 12. Drawing Dots, Lines, and Text on the Graph Screen (Sketch)
- 13. Function Analysis
- Chapter 6 Statistical Graphs and Calculations
- 1. Before Performing Statistical Calculations
- 2. Calculating and Graphing Single-Variable Statistical Data
- 3. Calculating and Graphing Paired-Variable Statistical Data (Curve Fitting)
- 4. Performing Statistical Calculations
- 5. Tests
- 6. Confidence Interval
- 7. Distribution
- 8. Input and Output Terms of Tests, Confidence Interval, and Distribution
- 9. Statistic Formula
- Chapter 7 Financial Calculation
- Chapter 8 Programming
- Chapter 9 Spreadsheet
- Chapter 10 eActivity
- Chapter 11 Memory Manager
- Chapter 12 System Manager
- Chapter 13 Data Communication
- Chapter 14 Geometry
- Chapter 15 Picture Plot
- Chapter 16 3D Graph Function
- Chapter 17 Python (fx-CG50, fx-CG50 AU only)
- Chapter 18 Distribution (fx-CG50, fx-CG50 AU only)
- Appendix
- Examination Modes
- E-CON4 Application (English)
- 1. E-CON4 Mode Overview
- 2. Sampling Screen
- 3. Auto Sensor Detection (CLAB Only)
- 4. Selecting a Sensor
- 5. Configuring the Sampling Setup
- 6. Performing Auto Sensor Calibration and Zero Adjustment
- 7. Using a Custom Probe
- 8. Using Setup Memory
- 9. Starting a Sampling Operation
- 10. Using Sample Data Memory
- 11. Using the Graph Analysis Tools to Graph Data
- 12. Graph Analysis Tool Graph Screen Operations
- 13. Calling E-CON4 Functions from an eActivity

9-2
Restrictions on the Use of Spreadsheet Strips in the eActivity Mode
Main Memory data storage capacity is approximately 60KB. Approximately half of that (a little
less than 30KB) is the maximum amount of data storage available in the eActivity mode.
Approximately half of the eActivity mode storage memory (a little less than 15KB) is the
maximum allowable Spreadsheet file size in the eActivity mode.
Because of this, inserting a Spreadsheet strip into an eActivity and performing a spreadsheet
operation can cause limitations due to insufficient memory capacity. The following are
examples of conditions that would cause the maximum file size to be exceeded.
(1) Inputting numeric data into spreadsheet cells A1 through A999, B1 through B999, and C1
through C520
In this case, the Spreadsheet strip of the eActivity will show only A1 through A999 and B1
through B80.
(2) Without inputting any data into the spreadsheet, assigning the conditional formatting shown
below to all of the cells from A1 through A999 and B1 through B430
- For “Type”, select “Expression”.
- Input the following expression: B1=2 A1^3+3 A1^2+4 A1+5.
In this case, the Spreadsheet strip of the eActivity will show only A1 through A999 and B1
through B410.
k Spreadsheet Screen Function Menu
• { FILE } ... Displays the following FILE submenu.
• { NEW } / { OPEN } / { SAVE
•
AS } / { RECALCS }/{CSV}
• { EDIT } ... Displays the following EDIT submenu.
• { CUT } / { PASTE } / { COPY } / { CELL } / { JUMP } / { SEQ } / { FILL } / { SORTASC } / { SORTDES }
• PASTE is displayed only immediately after CUT or COPY is executed.
• { DELETE } ... Displays the following DELETE submenu.
• { ROW } / { COLUMN } / { ALL }
• { INSERT } ... Displays the following INSERT submenu.
• { ROW } / { COLUMN }
• {CLEAR} ... Displays the following CLEAR submenu.
• {CONTENT}/{FORMAT}/{ALL}
• { GRAPH } ... Displays the following GRAPH menu. (Same as in the Statistics mode.)
• { GRAPH1 } / { GRAPH2 } / { GRAPH3 } / { SELECT } / { SET }
• { CALC } ... Displays the following CALC (statistical calculation) menu. (Same as in the
Statistics mode.)
• { 1-VAR } / { 2-VAR } / { REG } / { SET }
• { STORE } ... Displays the following STORE submenu.
• { VAR } / { LIST } / { FILE } / { MAT }/{VCT}
• { RECALL } ... Displays the following RECALL submenu.
• { LIST } / { FILE } / { MAT }/{VCT}
• {CONDIT} ... Displays the conditional formatting setting screen.
• {COND1}/{COND2} ... Displays the {Condition1}/{Condition2} screens.