
User Manual
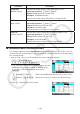
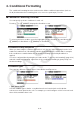
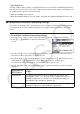
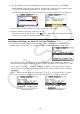
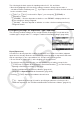
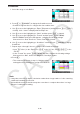
Table Of Contents
- Contents
- Getting Acquainted — Read This First!
- Chapter 1 Basic Operation
- Chapter 2 Manual Calculations
- 1. Basic Calculations
- 2. Special Functions
- 3. Specifying the Angle Unit and Display Format
- 4. Function Calculations
- 5. Numerical Calculations
- 6. Complex Number Calculations
- 7. Binary, Octal, Decimal, and Hexadecimal Calculations with Integers
- 8. Matrix Calculations
- 9. Vector Calculations
- 10. Metric Conversion Calculations
- Chapter 3 List Function
- Chapter 4 Equation Calculations
- Chapter 5 Graphing
- 1. Sample Graphs
- 2. Controlling What Appears on a Graph Screen
- 3. Drawing a Graph
- 4. Saving and Recalling Graph Screen Contents
- 5. Drawing Two Graphs on the Same Screen
- 6. Manual Graphing
- 7. Using Tables
- 8. Modifying a Graph
- 9. Dynamic Graphing
- 10. Graphing a Recursion Formula
- 11. Graphing a Conic Section
- 12. Drawing Dots, Lines, and Text on the Graph Screen (Sketch)
- 13. Function Analysis
- Chapter 6 Statistical Graphs and Calculations
- 1. Before Performing Statistical Calculations
- 2. Calculating and Graphing Single-Variable Statistical Data
- 3. Calculating and Graphing Paired-Variable Statistical Data (Curve Fitting)
- 4. Performing Statistical Calculations
- 5. Tests
- 6. Confidence Interval
- 7. Distribution
- 8. Input and Output Terms of Tests, Confidence Interval, and Distribution
- 9. Statistic Formula
- Chapter 7 Financial Calculation
- Chapter 8 Programming
- Chapter 9 Spreadsheet
- Chapter 10 eActivity
- Chapter 11 Memory Manager
- Chapter 12 System Manager
- Chapter 13 Data Communication
- Chapter 14 Geometry
- Chapter 15 Picture Plot
- Chapter 16 3D Graph Function
- Chapter 17 Python (fx-CG50, fx-CG50 AU only)
- Chapter 18 Distribution (fx-CG50, fx-CG50 AU only)
- Appendix
- Examination Modes
- E-CON4 Application (English)
- 1. E-CON4 Mode Overview
- 2. Sampling Screen
- 3. Auto Sensor Detection (CLAB Only)
- 4. Selecting a Sensor
- 5. Configuring the Sampling Setup
- 6. Performing Auto Sensor Calibration and Zero Adjustment
- 7. Using a Custom Probe
- 8. Using Setup Memory
- 9. Starting a Sampling Operation
- 10. Using Sample Data Memory
- 11. Using the Graph Analysis Tools to Graph Data
- 12. Graph Analysis Tool Graph Screen Operations
- 13. Calling E-CON4 Functions from an eActivity

9-26
u Procedure
1. Select the range of cells B3:C4.
2. Press 6(g)5(CONDIT) to display the Condition screen.
• Condition1 appears first, so configure the first condition here.
3. Use c to move the highlighting to “Expre” (Expression) and then press 6(g)1(C<).
• Initially, “Cell < Value” is displayed in the Expre line.
4. Use c to move the highlighting to “Value” and then press aw to input 0.
5. Use c to move the highlighting to “Format” and then press 1(SETFORM).
• On the FORMAT dialog box that appears, configure the following settings:
Character Color: Red, Area Color: Yellow, Paint Style: Normal.
6. Use f to move the highlighting to “Condition1” and then press 2(COND2) to display
Condition2.
7. Repeat steps 3 through 5 above to configure the Condition2 settings.
• Input 1(≤C≤) in the “Expre” line, aw in the “V1” line, and baaw in the
“V2” line.
• In the “Format” line, press 1(SETFORM) and then configure the following settings:
Character Color: Blue, Area Color: Magenta, Paint Style: Lighter.
8 Press J.
• This returns to the screen in step 1 of this procedure
and applies the formatting you configured to each cell.
Note
• It may take some time to display calculation results when a large number of cells containing
conditional formatting are selected.
• Cell modification and recalculation may take some time to complete when there is a large
amount of conditional formatting.