
User Manual
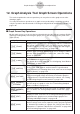
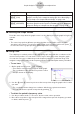
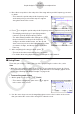
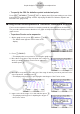
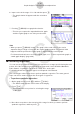
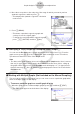
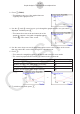
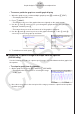
Table Of Contents
- 目录
- 介绍 — 请首先阅读这一部分!
- 第1章 基本操作
- 第2章 手动计算
- 第3章 列表功能
- 第4章 方程计算
- 第5章 绘图
- 第6章 统计图形与计算
- 第7章 财务计算
- 第8章 编程
- 第9章 数据表格
- 第10章 eActivity
- 第11章 存储器管理器
- 第12章 系统管理器
- 第13章 数据通信
- 第14章 几何
- 第15章 教学探索
- 第16章 3D图形函数
- 第17 章 Python(仅限fx-CG50)
- 第18章 分布(仅限fx-CG50)
- 附录
- 考试模式
- E-CON4 Application (English)
- 1. E-CON4 Mode Overview
- 2. Sampling Screen
- 3. Auto Sensor Detection (CLAB Only)
- 4. Selecting a Sensor
- 5. Configuring the Sampling Setup
- 6. Performing Auto Sensor Calibration and Zero Adjustment
- 7. Using a Custom Probe
- 8. Using Setup Memory
- 9. Starting a Sampling Operation
- 10. Using Sample Data Memory
- 11. Using the Graph Analysis Tools to Graph Data
- 12. Graph Analysis Tool Graph Screen Operations
- 13. Calling E-CON4 Functions from an eActivity

ε-40
Graph Analysis Tool Graph Screen Operations
Key Operation Description
K5(Y=fx)
Displays the graph relation list, which lets you select a Y=f(x)
graph to overlay on the sampled result graph. See “Overlaying a
Y=f(x) Graph on a Sampled Result Graph” on page
ε-46.
K6(SPEAKER)
Starts an operation for outputting a specific range of a sound data
waveform graph from the speaker (EA-200 only). See “Outputting
a Specific Range of a Graph from the Speaker” on page
ε-48.
k Scrolling the Graph Screen
Press the cursor keys while the graph screen is on the display scrolls the graph left, right, up,
or down.
Note
• The cursor keys perform different operations besides scrolling while a trace or graph
operation is in progress. To perform a graph screen scroll operation in this case, press J
to cancel the trace or graph operation, and then press the cursor keys.
k Using Trace
Trace displays a crosshair pointer on the displayed graph along with the coordinates of the
current cursor position. You can use the cursor keys to move the pointer along the graph.
You can also use trace to obtain the periodic frequency value for a particular range, and
assign the range (time) and periodic frequency values in separate Alpha memory variables.
• To use trace
1. On the graph screen, press !1(TRACE).
• This causes a trace pointer to appear on the graph.
The coordinates of the current trace pointer location
are also shown on the display.
2. Use the d and e cursor keys to move the trace pointer along the graph to the location
you want.
• The coordinate values change in accordance with the trace pointer movement.
• You can exit the trace pointer at any time by pressing J.
• To obtain the periodic frequency value
1. Use the procedure under “To use trace” above to start a trace operation.
2. Move the trace pointer to the start point of the range whose periodic frequency you want
to obtain, and then press w.