
User Manual

ε-46
Graph Analysis Tool Graph Screen Operations
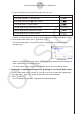
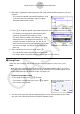
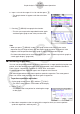
4. Move the trace pointer to the end point of the range for which you want to perform
quadratic regression, and then press w.
• This displays the quadratic regression calculation
result screen.
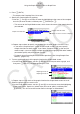
5. Press 6(DRAW).
• This draws a quadratic regression graph and
overlays it over the original graph.
• To delete the overlaid quadratic regression graph,
press !4(SKETCH) and then 1(Cls).
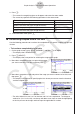
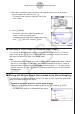
k Overlaying a Y=f(x) Graph on a Sampled Result Graph
You can use the E-CON4 mode to graph equations based on the form Y=f(x). From the
graph screen, press K5(Y=fx) to display the graph relation list screen. From there,
operations are identical to those in the Graph mode.
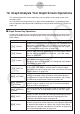
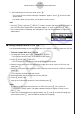
Note
• The data on the graph relation list screen is shared with the Graph mode. Note, however,
that only Y= type graphs can be used in the E-CON4 mode. Because of this, calling up
the graph relation list screen from the E-CON4 mode will display a “Y” (Y= type) item for
function menu key 3. Also, 5(MODIFY) is not displayed, because it is not used in the
E-CON4 mode.
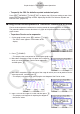
k Working with Multiple Graphs (Not included on the Manual Sampling)
The procedures in this section explain how you can zoom or move a particular graph when
there are multiple graphs on the display.
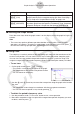
• To zoom a particular graph on a multi-graph display
1. When the graph screen contains multiple graphs, press K, and then 3(EDIT).
• The EDIT menu appears at the bottom of the display.