
user manual

Chapter 3: Graph & Table Application 101
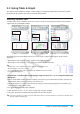
2. If you want to configure settings using preset ClassPad View Window parameters, perform the operations
described below.
To configure this setting: Do this:
ClassPad initial defaults On the [Memory] menu select [Initial], or tap the
[Default] button.
Configure settings optimized for trigonometric
function graphing
On the [Memory] menu, select [Trigonometric].
Display both the
x-axis and y-axis in a range of
–10 to 10
On the [Memory] menu, select [Standard].
Configure View Window settings that maintain the
current background image
On the [Memory] menu, select [Picture].
Configure parameters automatically optimized for
a graph
On the [Memory] menu, select [Auto].
• For details about each preset parameter, see “View Window Preset Parameters” (page 102).
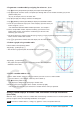
3. Configure View Window parameters required for the type of graph you want to draw.
Rectangular Coordinates
Use this item: To configure this View Window parameter:
xmin x-axis minimum value
xmax x-axis maximum value (Specify a value greater than xmin.)
xscale x-axis marker spacing
xdot Value of each dot on the x-axis
ymin y-axis minimum value
ymax y-axis maximum value (Specify a value greater than ymin.)
yscale y-axis marker spacing
ydot Value of each dot on the y-axis
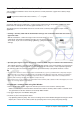
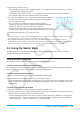
• Selecting the
x-log and/or y-log check box at the top of the display will switch the applicable axis to
logarithmic scale. Selecting one of the check boxes results in a semi-log graph, while selecting both check
boxes results in a log-log graph.
Polar Coordinates and Parametric Coordinates
Use this item: To configure this View Window parameter:
t min Minimum value of t
t max Maximum value of t
t step Step size of t (Specify a non-zero value.)
4. After all the parameters are the way you want, tap [OK].
• When you tap [OK] after changing View Window dialog box settings, the graph is redrawn automatically
using the new View Window settings.