
user manual


Chapter 5: Differential Equation Graph Application 122
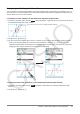
3. On the Differential Equation Graph window, tap the coordinates that you want to specify as the new initial
condition.
• This will set the coordinates as the new initial condition and draw a solution curve.
• The newly configured initial condition is added to the initial condition editor. To view it, tap the [IC] tab.
Configuring Differential Equation Graph View Window Parameters
You can set a number of graphing parameters on the View Window dialog box. This dialog box contains two
tabs.
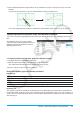
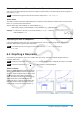
The [Window] tab lets you set the window
values and steps used for graphing a field. The
[Solutions] tab contains parameters used for
graphing solution curves.
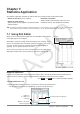
u To configure differential equation graph View Window settings
1. Tap 6 to display the View Window dialog box.
2. Input the required parameters on the [Window] and [Solutions] tabs.
• See “Differential equation graph View Window parameters” below.
3. After the settings are the way you want, tap [OK].
Differential equation graph View Window parameters
[Window] tab
Setting Description
xmin, xmax Minimum/maximum value along the (horizontal) x-axis
ymin, ymax Minimum/maximum value along the (vertical) y-axis
Field Specifies display of arrow, line or nothing.
Steps Number of steps or field lines used for graphing a field
[Solutions] tab
The variable assignments available on the [Solutions] tab vary depending on the graph type selected with the
Graph Editor. Some graph types have preset assignments for the independent,
x-axis, and y-axis variables. If a
value is preset for the current graph type the value will still be displayed on the Solutions tab, but you will not be
able to change it.