
user manual

Chapter 7: Statistics Application 140
2. On the Command menu, select the
command you want to execute.
• For information about what is calculated
by each command, see “Tests” (page
141), “Confidence Intervals” (page 143), and
“Distributions” (page 145).
3. Select “List” to use list data for calculation,
or “Variable” to directly input values using a
wizard.
• Certain commands require data of a
specific type (list, variable, or matrix) for
calculation. For such commands, you will
not be provided with a choice of data type
options.
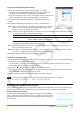
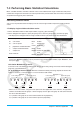
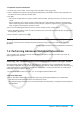
Type menu
Command menu
Help text
Displayed when the [Help]
check box is selected.
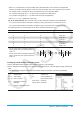
4. Tap [Next >>].
• This displays a screen for specifying conditions and inputting values.
• Initially, the top item on the screen will be selected, with help text about
the top item shown at the bottom of the screen. Tapping another item will
select it and display help text about it.
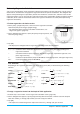
5. Input values and configure settings for each of the items on the screen.
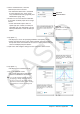
6. Tap [Next >>].
• This displays the calculation results.
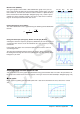
7. Tap $ to graph the results.
• You cannot graph interval calculations
and inverse distribution calculations.
Tip: You can back-step through the wizard
by tapping [<< Back]. After returning to a
previous screen you can change settings
and values and recalculate results. Closing
the wizard screen clears all settings and
values.