
user manual


Chapter 1: Basics 36
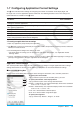
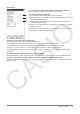
k Graph Format Dialog Box
Use the Graph Format dialog box to configure settings for the Graph window and for drawing graphs.
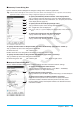
[Basic] tab
1
2
3
4
To specify display of Graph window axes
Tap 1 and then tap one of the settings described below.
On: show axis Off: hide axis
Number*: show axis along with maximum and minimum value of each axis
To specify display of Graph window grid
Tap 2 and then tap one of the settings described below.
On: show grid as dots Off: hide grid
Line*: show grid as lines
To select inequality fill specification (Inequality Plot)
Tap 3 and then tap one of the settings described below.
Union*: fill areas where all inequality conditions are satisfied when
graphing multiple inequalities
Intersection: fill areas where each inequality condition is satisfied when
graphing multiple inequalities
To specify the color of figures and graphs drawn with the Sketch function (page 110)
Tap 4. On the dialog box that appears, select the color you want and then tap [OK].
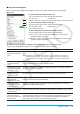
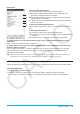
To do this: Do this:
Turn display of Graph
window axis labels on
or off
Select the “Labels” check box* to show labels, or clear the check box to hide
labels.
Tip: Regardless of the “Labels” setting, labels are never displayed on the Sequence
application Graph window. Also, labels are not displayed for the following types
of graph drawn with the Statistics application: NPPlot, Histogram, MedBox, NDist
Broken.
Turn display of graph
controller arrows on
or off
Select the “G-Controller” check box to show graph controller arrows (page 103), or
clear the check box* to hide graph controller arrows.
Specify plotted points
or solid lines for graph
drawing
Select the “Draw Plot” check box to specify plotted points, or clear the check box*
to specify solid lines for graphing.
Turn display of the
function name and
function on or off
Select the “Graph Function” check box* to show the function name and function on
the graph, or clear the check box to hide the function name and function.
Turn display of Graph
window pointer
coordinates on or off
Select the “Coordinates” check box* to show Graph window pointer coordinates, or
clear the check box to hide the coordinates.
Turn display of the
leading cursor during
graphing on or off
Select the “Leading Cursor” check box to show the leading cursor, or clear the
check box* to hide the leading cursor.
Specify the draw
method when drawing
multiple graphs
Select the “Simultaneous Graphs” check box to draw multiple graphs
simultaneously, or clear the check box* to draw graphs in sequence, one at a time.
Show or hide
derivative values on
the Graph window and
Table window
Select the “Derivative/Slope” check box to show derivative values in the Graph
window and Table window, or clear the check box* to hide derivative values. For
details about display contents, see “Using Trace to Read Graph Coordinates”
(page 109) and “Generating a Number Table” (page 106).