
user manual


Chapter 3: Graph & Table Application 98
To input this type of
expression:
Do this:
x equality 1. Tap [Type] - [x=Type].
2. Input an expression that includes variable
y and then press E.
y inequality
(left side y type)
1. Tap [Type], [Inequality], and then tap one of the following:
[
y>Type], [y<Type], [ytType], [ysType].
2. Input an expression that includes variable
x and then press E.
x inequality
(left side x type)
1. Tap [Type], [Inequality], and then tap one of the following:
[
x>Type], [x<Type], [xtType], [xsType].
2. Input an expression that includes variable
y and then press E.
Shade Type See “Shading the Region Bounded by Two Expressions” (page 99).
Tip: You can change the equality/inequality sign of an x-type (x=, x>, x<, xt, xs) or y-type (y=, y>, y<, yt, ys, Shade
Type) expression after you input it. Simply tap the current equality/inequality sign. On the Type dialog box that
appears, select the sign you want and then tap [OK].
Graphing a Stored Function
You can select multiple functions and graph them simultaneously, as long as all of the functions are on the
same sheet. You can turn graphing of each function on or off, and even specify the line style and color to be
used for each function.
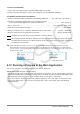
u To graph a specified function
1. Tap the tab of the sheet that contains the functions you want to graph to
make it active.
2. Select the check boxes of all the functions you want to graph, and clear the
check boxes of all the functions you do not want to graph.
3. You can tap the current line style and color to specify another style, if you
want.
• See “To specify the graph line style and color” below.
4. Tap $ to graph.
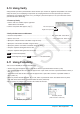
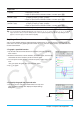
u To specify the graph line style and color
1. Tap the style area next to the function whose line style and
color you want to specify. This displays the Style Settings
dialog box.
Style area