
User guide


MESURgauge Software
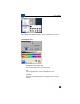
Cursor Movement Tool
Clicking this button allows the X-Y cursor to be dragged to
the desired position.
Pass/Fail Limit Lines
Horizontal lines corresponding to the pass/fail limits set are
displayed on the graph in red.
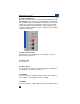
5.2 REFRESH GRAPH
Redraws the graph based on the data collected during the test.
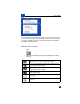
5.3 Cursor Palette
Center Cursor
Centers the cursor in the graph area.
Cursor Control
Click on the quadrants of this icon to move the cursor in the
corresponding direction.
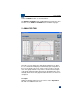
Cursor Table
Displays the cursor position’s X and Y values.
19