
User's Manual Part 1
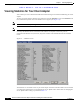
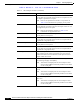
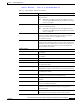
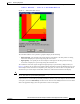
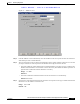
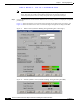
Table Of Contents
- contents
- Preface
- Product Overview
- Preparing for Installation
- Installing the Client Adapter
- Using the Profile Manager
- Configuring the Client Adapter
- Overview
- Setting System Parameters
- Setting RF Network Parameters
- Setting Advanced Infrastructure Parameters
- Setting Advanced Ad Hoc Parameters
- Setting Network Security Parameters
- Using EAP Authentication
- Performing Diagnostics

BETA DRAFT - CISCO CONFIDENTIAL
7-11
Cisco Aironet Wireless LAN Client Adapters Installation and Configuration Guide for Windows
OL-1394-03
Chapter 7 Performing Diagnostics
Viewing the Current Status of Your Client Adapter
Current Beacons Received
(5-GHz client adapters)
The percentage of beacon packets received versus those expected to be
received. The higher the value and the more green the bar graph is, the
clearer the signal.
Example: The access point sends out 10 beacons per second, so you
would expect the client adapter to receive 50 beacon packets
in 5 seconds. If it receives only 40 packets, the percentage of
beacons received would be 80%.
Range: 0 to 100%
Note This setting appears only for 5-GHz client adapters (or for
2.4-GHz client adapters using firmware version less than 4.05)
and only if you selected signal strength to be displayed as a
percentage. See the Signal Strength Display Units parameter in
Table 7-2 for information.
Current Noise Level The level of background radio frequency energy in the 2.4- or 5-GHz
band. The lower the value and the more green the bar graph is, the less
background noise present.
Range: –100 to –45 dBm
Note This setting appears only if you selected signal strength to be
displayed in dBm. See the Signal Strength Display Units
parameter in Table 7-2 for information.
Overall Link Quality The client adapter’s ability to communicate with the access point,
which is determined by the combined result of the adapter’s signal
strength and signal quality.
Value: Not Associated, Poor, Fair, Good, Excellent
Note This setting appears only if you selected signal strength to be
displayed as a percentage. See the Signal Strength Display
Units parameter in Table 7-2 for information.
Signal To Noise Ratio The difference between the signal strength and the current noise level.
The higher the value, the better the client adapter’s ability to
communicate with the access point.
Range: 0 to 90 dB
Note This setting appears only if you selected signal strength to be
displayed in dBm. See the Signal Strength Display Units
parameter in Table 7-2 for information.
Table 7-3 Client Adapter Status (continued)
Status Description