
User's Manual Part 1
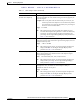
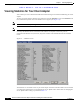
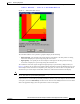
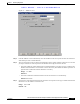
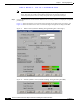
Table Of Contents
- contents
- Preface
- Product Overview
- Preparing for Installation
- Installing the Client Adapter
- Using the Profile Manager
- Configuring the Client Adapter
- Overview
- Setting System Parameters
- Setting RF Network Parameters
- Setting Advanced Infrastructure Parameters
- Setting Advanced Ad Hoc Parameters
- Setting Network Security Parameters
- Using EAP Authentication
- Performing Diagnostics

BETA DRAFT - CISCO CONFIDENTIAL
7-17
Cisco Aironet Wireless LAN Client Adapters Installation and Configuration Guide for Windows
OL-1394-03
Chapter 7 Performing Diagnostics
Viewing the Link Status Meter
Figure 7-5 Link Status Meter Screen
The Link Status Meter screen provides a graphical display of the following:
• Signal strength – The strength of the client adapter’s radio signal at the time packets are being
received. It is displayed as a percentage along the vertical axis.
• Signal quality – The quality of the client adapter’s radio signal at the time packets are being
received. It is displayed as a percentage along the horizontal axis.
The combined result of the signal strength and signal quality is represented by a diagonal line (see
Figure 7-5). Where the line falls on the graphical display determines whether the RF link between your
client adapter and its associated access point is poor, fair, good, or excellent. The access point that is
associated to your client adapter and its MAC address are indicated at the bottom of the display.
Note ACU’s Status screen also shows signal strength and signal quality. However on the Status
screen, these data are represented by histograms.
If you want to see a recent history of the RF performance between your client adapter and its associated
access point, select the Show History checkbox on the Aironet Client Utility Preferences screen. Black
dots on the graphical display show the performance of the last 50 signals.