
User's Manual
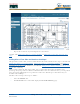


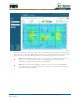

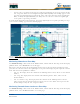
Table Of Contents
- Welcome to the Product Guide!
- Legal Information
- Obtaining Documentation
- Documentation Feedback
- Cisco Product Security Overview
- Obtaining Technical Assistance
- Obtaining Additional Publications and Information
- FCC Statements for Cisco 1000 Series Lightweight Access Points
- Industry Canada Required User Information for Cisco 1000 Series Lightweight Access Points
- FCC Statements for Cisco 4100 Series Wireless LAN Controllers
- FCC Statements for Cisco 2000 Series Wireless LAN Controllers
- Safety Considerations
- OVERVIEWS
- About the Cisco Structured Wireless-Aware Network
- Single-Cisco Wireless LAN Controller Deployments
- Multiple-Cisco Wireless LAN Controller Deployments
- About the Operating System Software
- About Operating System Security
- About Cisco SWAN Wired Security
- Layer 2 and Layer 3 LWAPP Operation
- About Radio Resource Management (RRM)
- About the Master Cisco Wireless LAN Controller
- About the Primary, Secondary, and Tertiary Cisco Wireless LAN Controllers
- About Client Roaming
- About Client Location
- About External DHCP Servers
- About Controller Mobility Groups
- About Cisco SWAN Wired Connections
- About Cisco SWAN WLANs
- About Access Control Lists
- About Identity Networking
- About File Transfers
- About Power Over Ethernet
- Pico Cell Functionality
- Intrusion Detection Service (IDS)
- About Cisco Wireless LAN Controllers
- About Cisco 2000 Series Wireless LAN Controllers
- Cisco 4100 Series Wireless LAN Controllers
- Cisco Wireless LAN Controller Features
- Cisco 2000 Series Wireless LAN Controller Model Numbers
- Cisco 4100 Series Wireless LAN Controller Model Numbers
- Appliance Mode
- About Distribution System Ports
- About the Management Interface
- About the AP-Manager Interface
- About Operator-Defined Interfaces
- About the Virtual Interface
- About the Service Port
- About the Service-Port Interface
- About the Startup Wizard
- About Cisco Wireless LAN Controller Memory
- Cisco Wireless LAN Controller Failover Protection
- Cisco Wireless LAN Controller Automatic Time Setting
- Cisco Wireless LAN Controller Time Zones
- Network Connection to Cisco Wireless LAN Controllers
- VPN/Enhanced Security Module
- About Cisco 1000 Series IEEE 802.11a/b/g Lightweight Access Points
- About Cisco 1030 IEEE 802.11a/b/g Remote Edge Lightweight Access Points
- About Cisco 1000 Series Lightweight Access Point Models
- About Cisco 1000 Series Lightweight Access Point External and Internal Antennas
- About Cisco 1000 Series Lightweight Access Point LEDs
- About Cisco 1000 Series Lightweight Access Point Connectors
- About Cisco 1000 Series Lightweight Access Point Power Requirements
- About Cisco 1000 Series Lightweight Access Point External Power Supply
- About Cisco 1000 Series Lightweight Access Point Mounting Options
- About Cisco 1000 Series Lightweight Access Point Physical Security
- About Cisco 1000 Series Lightweight Access Point Monitor Mode
- About Rogue Access Points
- About the Cisco Wireless Control System
- About the Web User Interface
- About the Command Line Interface
- About the Cisco Structured Wireless-Aware Network
- SOLUTIONS
- Operating System Security
- Converting a Cisco SWAN from Layer 2 to Layer 3 Mode
- Converting a Cisco SWAN from Layer 3 to Layer 2 Mode
- Configuring a Firewall for Cisco WCS
- Configuring the System for SpectraLink NetLink Telephones
- Using Management over Wireless
- Configuring a WLAN for a DHCP Server
- Customizing the Web Auth Login Screen
- Configuring Identity Networking for Operating System 2.2
- TASKS
- Using the Cisco SWAN CLI
- Configuring Cisco Wireless LAN Controllers
- Collecting Cisco Wireless LAN Controller Parameters
- Configuring System Parameters
- Configuring Cisco Wireless LAN Controller Interfaces
- Creating Access Control Lists
- Configuring WLANs
- Configuring Controller Mobility Groups
- Configuring RADIUS
- Configuring SNMP
- Configuring Other Ports and Parameters
- Adding SSL to the Web User Interface
- Transferring Files To and From a Cisco Wireless LAN Controller
- Updating the Operating System Software
- Using the Startup Wizard
- Adding SSL to the Web User Interface
- Adding SSL to the 802.11 Interface
- Saving Configurations
- Clearing Configurations
- Erasing the Cisco Wireless LAN Controller Configuration
- Resetting the Cisco Wireless LAN Controller
- Using the Cisco Wireless Control System
- Starting and Stopping Windows Cisco WCS
- Starting and Stopping Linux Cisco WCS
- Starting and Stopping the Cisco WCS Web Interface
- Using Cisco WCS
- Checking the Cisco SWAN Network Summary
- Adding a Cisco Wireless LAN Controller to Cisco WCS
- Creating an RF Calibration Model
- Adding a Campus Map to the Cisco WCS Database
- Adding a Building to a Campus
- Adding a Standalone Building to the Cisco WCS Database
- Adding an Outdoor Area to a Campus
- Adding Floor Plans to a Campus Building
- Adding Floor Plans to a Standalone Building
- Adding APs to Floor Plan and Outdoor Area Maps
- Monitoring Predicted Coverage (RSSI)
- Monitoring Channels on Floor Map
- Monitoring Transmit Power Levels on a Floor Map
- Monitoring Coverage Holes on a Floor Map
- Monitoring Users on a Floor Map
- Monitoring Clients From a Floor Map
- Troubleshooting with Cisco WCS
- Detecting and Locating Rogue Access Points
- Acknowledging Rogue APs
- Locating Clients
- Finding Coverage Holes
- Pinging a Network Device from a Cisco Wireless LAN Controller
- Viewing Current Cisco Wireless LAN Controller Status and Configurations
- Viewing Cisco WCS Statistics Reports
- Updating OS Software from Cisco WCS
- Managing Cisco WCS and Database
- Installing Cisco WCS
- Updating Windows Cisco WCS
- Updating Linux Cisco WCS
- Reinitializing the Windows Cisco WCS Database
- Reinitializing the Linux Cisco WCS Database
- Administering Cisco WCS Users and Passwords
- Using the Web User Interface
- Troubleshooting Tips
- REFERENCES

4/1/05 Adding APs to Floor Plan and Open Area Maps
OL-7426-02
Note that the Cisco 1000 Series lightweight access point icons appear in the upper left area of
the map.
• Left-click and drag the Cisco 1000 Series lightweight access point icons to indicate their
physical locations.
• Highlight each Cisco 1000 Series lightweight access point icon in turn, and select the Antenna
Angle.
• If you have imported a .PNG, .JPG, or .GIF format Coverage Area map, click Save to store the
Cisco 1000 Series lightweight access point locations and orientations, and have Cisco WCS
compute the first-order RF prediction (or “Heat Map”) for the Coverage Area.
Note: The Antenna Angle is relative to the Map “X” axis. Because the origin of the
“X” and “Y” axes is at the upper left hand corner of the Map, 0 degrees points Side A
of the Cisco 1000 Series lightweight access point to the right, 90 degrees points
Side A down, 180 degrees points Side A to the left, and so on.
Note: In the following example, AP1 and AP3 are set to 90 degrees, and AP2 is set to
0 degrees, so the three Cisco 1000 Series lightweight access points provide
maximum coverage for the inside of the building and not the loading dock.
Also note that the first display is only an approximation of the actual RF signal inten-
sity, because it does not take into account the attenuation of various building
materials, such as drywall or metal objects, nor does it display the effects of RF
signals bouncing off obstructions.