
Installation Manual Part 5
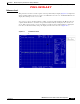
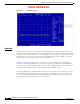
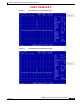
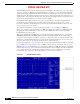

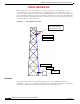
Table Of Contents

PRELIMINARY
D-6
BWX 8415 Basestation Installation and Commissioning Guide
OL-19519-01
Appendix D RF Center Frequency and Interference Analysis Guidelines
Spectrum Analyzer Settings
The bandwidth parameter is used for the measurement and display of the signal level across a given range
or span of frequencies. Within a given bandwidth there are 2 settings — one is Resolution bandwidth,
and the other is Video bandwidth. To discuss bandwidth, an understanding of the Spectrum Analyzer
display is needed. The display is broken out into frequencies and signal strength levels. Frequencies are
displayed left to right, which is called the Span. The signal level is displayed from top to bottom and is
shown with a signal strength level on the left side of the display.
Bandwidth in the Frequency Domain test is tied to the span function. Resolution bandwidth is the
measurement steps or slices that the Spectrum Analyzer uses while sweeping across the span of
frequencies. The Video bandwidth is the steps that the Spectrum Analyzer displays to the screen as it
sweeps across the span of frequencies.
Two different bandwidths are used in the following examples. One is 10 KHz in a 5 MHz span
(
Figure D-5), and the second is 100 KHz in a 5 MHz span (Figure D-6). With the 10 KHz bandwidth,
the Spectrum Analyzer will make 500 steps to sweep the 5 MHz span, whereas on the 100 KHz
bandwidth only 50 steps are made.
With a wider bandwidth (100 KHz) the receiver front-end of the Spectrum Analyzer is opened wider,
allowing for more noise to be input. With the smaller bandwidth (10 KHz) the Spectrum Analyzer
receiver is narrower and less susceptible to outside noise, thus giving a more accurate measurement. The
drawback to a smaller bandwidth is the sweep time for the Spectrum Analyzer to step across the span.
The sweep time increases, affecting the amount of time to perform the tests.
Figure D-5 and Figure D-6 show the effect on the noise floor by increasing the bandwidth from 10 KHz
up to 100 KHz. The setup in Figure D-5 is a 10 KHz resolution and video bandwidth, and a span of 5
MHz. In Figure D-6 the bandwidth was increased from 10 KHz to 100 KHz. By raising the bandwidth
in Figure D-6, more noise was seen by the Spectrum Analyzer, in effect raising the noise floor and hiding
over 10 dB of signal from view. When measuring for interference, this configuration can result in
measurement error, giving the view that the interference is not as bad as it truly is.
Figure D-5 10KHz Bandwidth Setting