
User's Guide
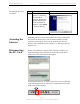
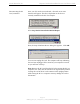
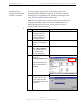
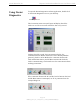
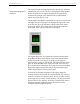
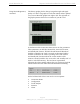
Table Of Contents
- Permissions, Trademarks & Distribution
- Safety
- Regulatory Information
- Introduction
- Package Inventory
- Ripwave Models
- Minimum Computing Requirements
- Physical Characteristics
- Installing the PC Card on Windows 2000
- Accessing the Internet
- Disconnecting the PC Card
- Indicator Light
- Troubleshooting
- Installing Navini Diagnostics (NavDiag) Software
- Using Navini Diagnostics
- Uninstalling Navini Diagnostics Software
- Optional Desktop Antenna
- Care and Maintenance
- Upgrading the PC Card
- ADDENDUM 1: PC Card - PC Troubleshooting
- ADDENDUM 2: End User Software License Agreement

Navini Networks, Inc. Ripwave Wireless Broadband Access Card User’s Guide
Page 19
050525_pv1.2_PC_Card_User’s_Guide_40-00292-00b(4.3)
Using Navini Diagnostics,
continued
The Signal Strength and Signal Quality are dynamic bar areas that
indicate how well your PC Card is receiving signals from the Base
Station. In particular, the Signal Strength bar area graphically
represents the strength of the Absolute BTS Synchronization
Signal received by the PC Card.
The strength of the signal is represented by a group of colored bars.
The higher the pile of bars goes, the stronger the signal. The color
of the bars also gives an indication of the strength of the signal.
Green lines indicate an excellent signal. Orange lines indicate a
good signal, while red lines indicate a weak signal.
The Signal Quality bar area graphically represents the Signal-to-
Noise Ratio (SNR) of the downlink access code channel (ACC)
received by the PC Card. Again, the quality of the signal is
represented by a group of colored bars. The higher the pile of bars
goes, the better the SNR of the signal. The color of the bars also
gives an indication of the quality of the signal. Green lines indicate
high quality signal. Orange lines indicate a good quality signal
while red lines indicate a low quality signal.
To increase the strength and quality of the signal, change the
location of the PC in which the PC Card is inserted. Try moving it
closer to a window, to a higher location, away from other wireless
devices (microwave ovens, cordless phones), and away from metal
objects (shelves, file cabinets). As the PC is repositioned, observe
the Signal Strength and Quality bars. Position the Card for
maximum signal strength and quality.