
User's Manual

Ripwave Base Station I&C Guide Navini Networks, Inc.
140 Part #40-00047-00 Rev D v1.0
February 28, 2003
Step 6. The result should be within +/- 0.5 dB of the calculated value. If the insertion loss
results do not agree with the manufacturer’s data, check the connectors for proper
connection to the cable, and check for kinks in the cable. If the Spectrum Analyzer has
a distance to fault (DTF) function, it can be used to help troubleshoot kinks in the
cable.
CAUTION! Cables with results greater than the specified limits (i.e., 2 or 3 dB high)
should not be installed, as a potential hardware fault exists.
Step 7. Record the data in the RFS System Test Form under “MAIN FEEDER LOSS” or
“JUMPER LOSS”. Ensure that the information is recorded under the channel number
that is on the cable label.
Step 8. Repeat steps 3 through 7 for all remaining cables and jumpers.
Step 9. Change the frequency to the next test frequency (refer back to the Test Setup section of
these procedures). Perform steps 1 – 8 until all cables have been successfully tested at
the frequencies shown in Table C5.
Test Procedure For RF Cables Already Run Up the Tower
Step 1. Ensure calibration of the test setup has been performed each time the test frequency is
changed.
Step 2. If present, remove the barrel connector from between the Signal Generator and
Spectrum Analyzer cables.
Step 3. Have a member of the tower crew, positioned at the upper end of the cables on the
tower, connect the calibration cable to antenna cable 1 with a barrel connector.
Step 4. At the lower end of the RF cables, connect the cable from the Signal Generator to the
calibration cable. Use a barrel connector to change the gender, if required.
Step 5. Connect the cable from the Spectrum Analyzer to antenna cable 1. Use a barrel
connector to change the gender, if required.
Step 6. Calculate the marker using the following formula: (the length of BOTH the calibration
cable and the antenna cable) x (loss per foot at the RFS center frequency for the type of
cable used).
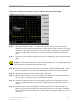
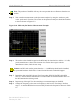
Step 7. Take a marker measurement on the Spectrum Analyzer by using the ‘marker to peak’
or the ‘peak search’ function. The screen on the Spectrum Analyzer should look similar
to the one shown in Figure C5.