
- Cisco WAN Modeling Tools User Guide
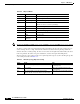
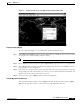

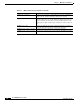
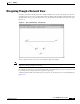
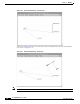
Table Of Contents
- Cisco WAN Modeling Tools User Guide
- Contents
- Related CWM and Switch Documentation
- Obtaining Documentation
- Documentation Feedback
- Cisco Product Security Overview
- Obtaining Technical Assistance
- Obtaining Additional Publications and Information
- Cisco WAN Modeling Tools Overview
- Functionality of the NMT
- Cisco Products Supported by the NMT
- Basic Usage/Charter Functionality
- Gaps
- Data Translation Tools
- System Requirements
- Installing the NMT
- Upgrading the NMT Software
- Starting the NMT
- Removing NMT
- Installing a Cisco WAN Modeling Tools Sub-application
- Removing Sub-applications
- Troubleshooting NMT Installation
- NMT Startup
- NMT Menu Bar
- File Menu
- Display Menu
- Keyboard Commands
- Modeling Processes
- Error Checking
- Troubleshooting NMT
- General Table Information
- Sites Table
- Links Table
- Link Special Cases
- Voice Table
- Data Table
- Bursty Table
- Interface Table
- Feeder Table
- Card Table
- Groups and Network Table
- Nodes Table
- Network Settings
- Model Options
- Feeders
- Obsolete Products
- FastPAD
- Port Concentrator
- Tiered Networks
- Using the Route Command
- AutoRoute
- AutoRoute Least Cost Routing
- PNNI Routing
- Fail Analysis Command
- Build Sites Command
- Optimize Command
- NMT Command Results
- Site Report
- Link Report
- Network Summary Report
- Link Load Report
- ATM & FR Ports Report (or Bursty Data Ports Report)
- Data & Voice Ports Report (or Voice & Data Ports Report)
- Connection Routes Report
- Failed Connections Report
- Parts List Report
- Resource Report/Card Statistics Report
- PNNI Topology Report
- View Summary
- Using the Map Tool
- NMT Map Startup
- Navigating Though a Network View
- Obtaining Link Information - Physical Links
- Obtaining Link Information - Logical Links
- Zooming the Map
- Panning the Map
- Map Color Coding
- Controlling Map Displays in NMT
- NMT Map Main Menu
- Adding New Groups
- Adding Nodes to Existing Groups
- Deleting Groups
- Deleting Nodes or Groups from Existing Groups
- Saving Your Work
- Retrieving Map Data Into NMT
- Using the Map Tool with Fail Analysis
- Using the Map Tool to Analyze Traffic Levels
- Fields Addressed by CET
- Using the CET
- Other CET Commands
- Troubleshooting CET
- Remote CET Extracts
- Translating Between NMT and WANDL Formats
- NMT to Microsoft Excel
- Microsoft Excel to NMT
- Usage Review
- SSI TroubleShooting
- CND PC Import Utilities
- Index

6-5
Cisco WAN Modeling Tools Guide
OL-10426-01, Rev. A0
Chapter 6 NMT Reports
Using the Map Tool
4 A UFMC T1 192 48 32 32 59
5 A UFMC T1 103 26 24 24 59
Legends:
FPL - Fast Packet Load : Percent of FP bus load / Total bus load.
GWL - Gateway Module Load : Percent of FP bus load / Max FP bus load.
====================================================================
This report tells us that the IGX switch with the ATM end is using 40 of its 584 UBU's, where the IGX
switch with the FR end is using 118 UBUs. Looking to the UXM trunk card on slot 3 for both switches,
the UXM trunk card at the ATM end is configured to reserve 25 UBUs of the bus, with the current traffic
load requiring 13. The maximum setting for this value for a UXM card is 235. The FPL percent means
that only 8% of the traffic on this card is in Fast Packets, and the GWL percent means that only 2% of
the maximum Fast Packets are being used by the card. Note that the FP traffic here is internally signaling
between the card and switch. At the FR end, the FPL is 100%, as all traffic on this card is FP. The GWL
is also%100 because this card can take no more FP traffic. It can take more ATM traffic.
Note Card Statistics output is in DBF format.
PNNI Topology Report
The PNNI Topology Report lists all the virtual links in the PNNI Topology.
View Summary
The View Summary Report is generated from the FILE/VIEW SUMMARY menu. This report gives you
an overview of the input plan CNF file. You can run this report without running the ROUTE or
OPTIMIZE execute command.
The output of the View Summary can also be displayed with the sniffcnf command from the UNIX CLI.
The utility command has options for displaying summary information for all or specific site locations
See the “Utility Commands” section for more information.
Using the Map Tool
The network topology map provides a useful tool for visualizing your network model. The map tool
provides the following features:
• Graphical display of the topology
• Help for conducting fail analysis
• Allows you to visualize traffic levels
Start the map after running an NMT command (for example, route, optimize, or failure analysis). If
you rerun an NMT command, select Update on the map to view the new results.
The map tool includes several menus, described in Table 6-1.